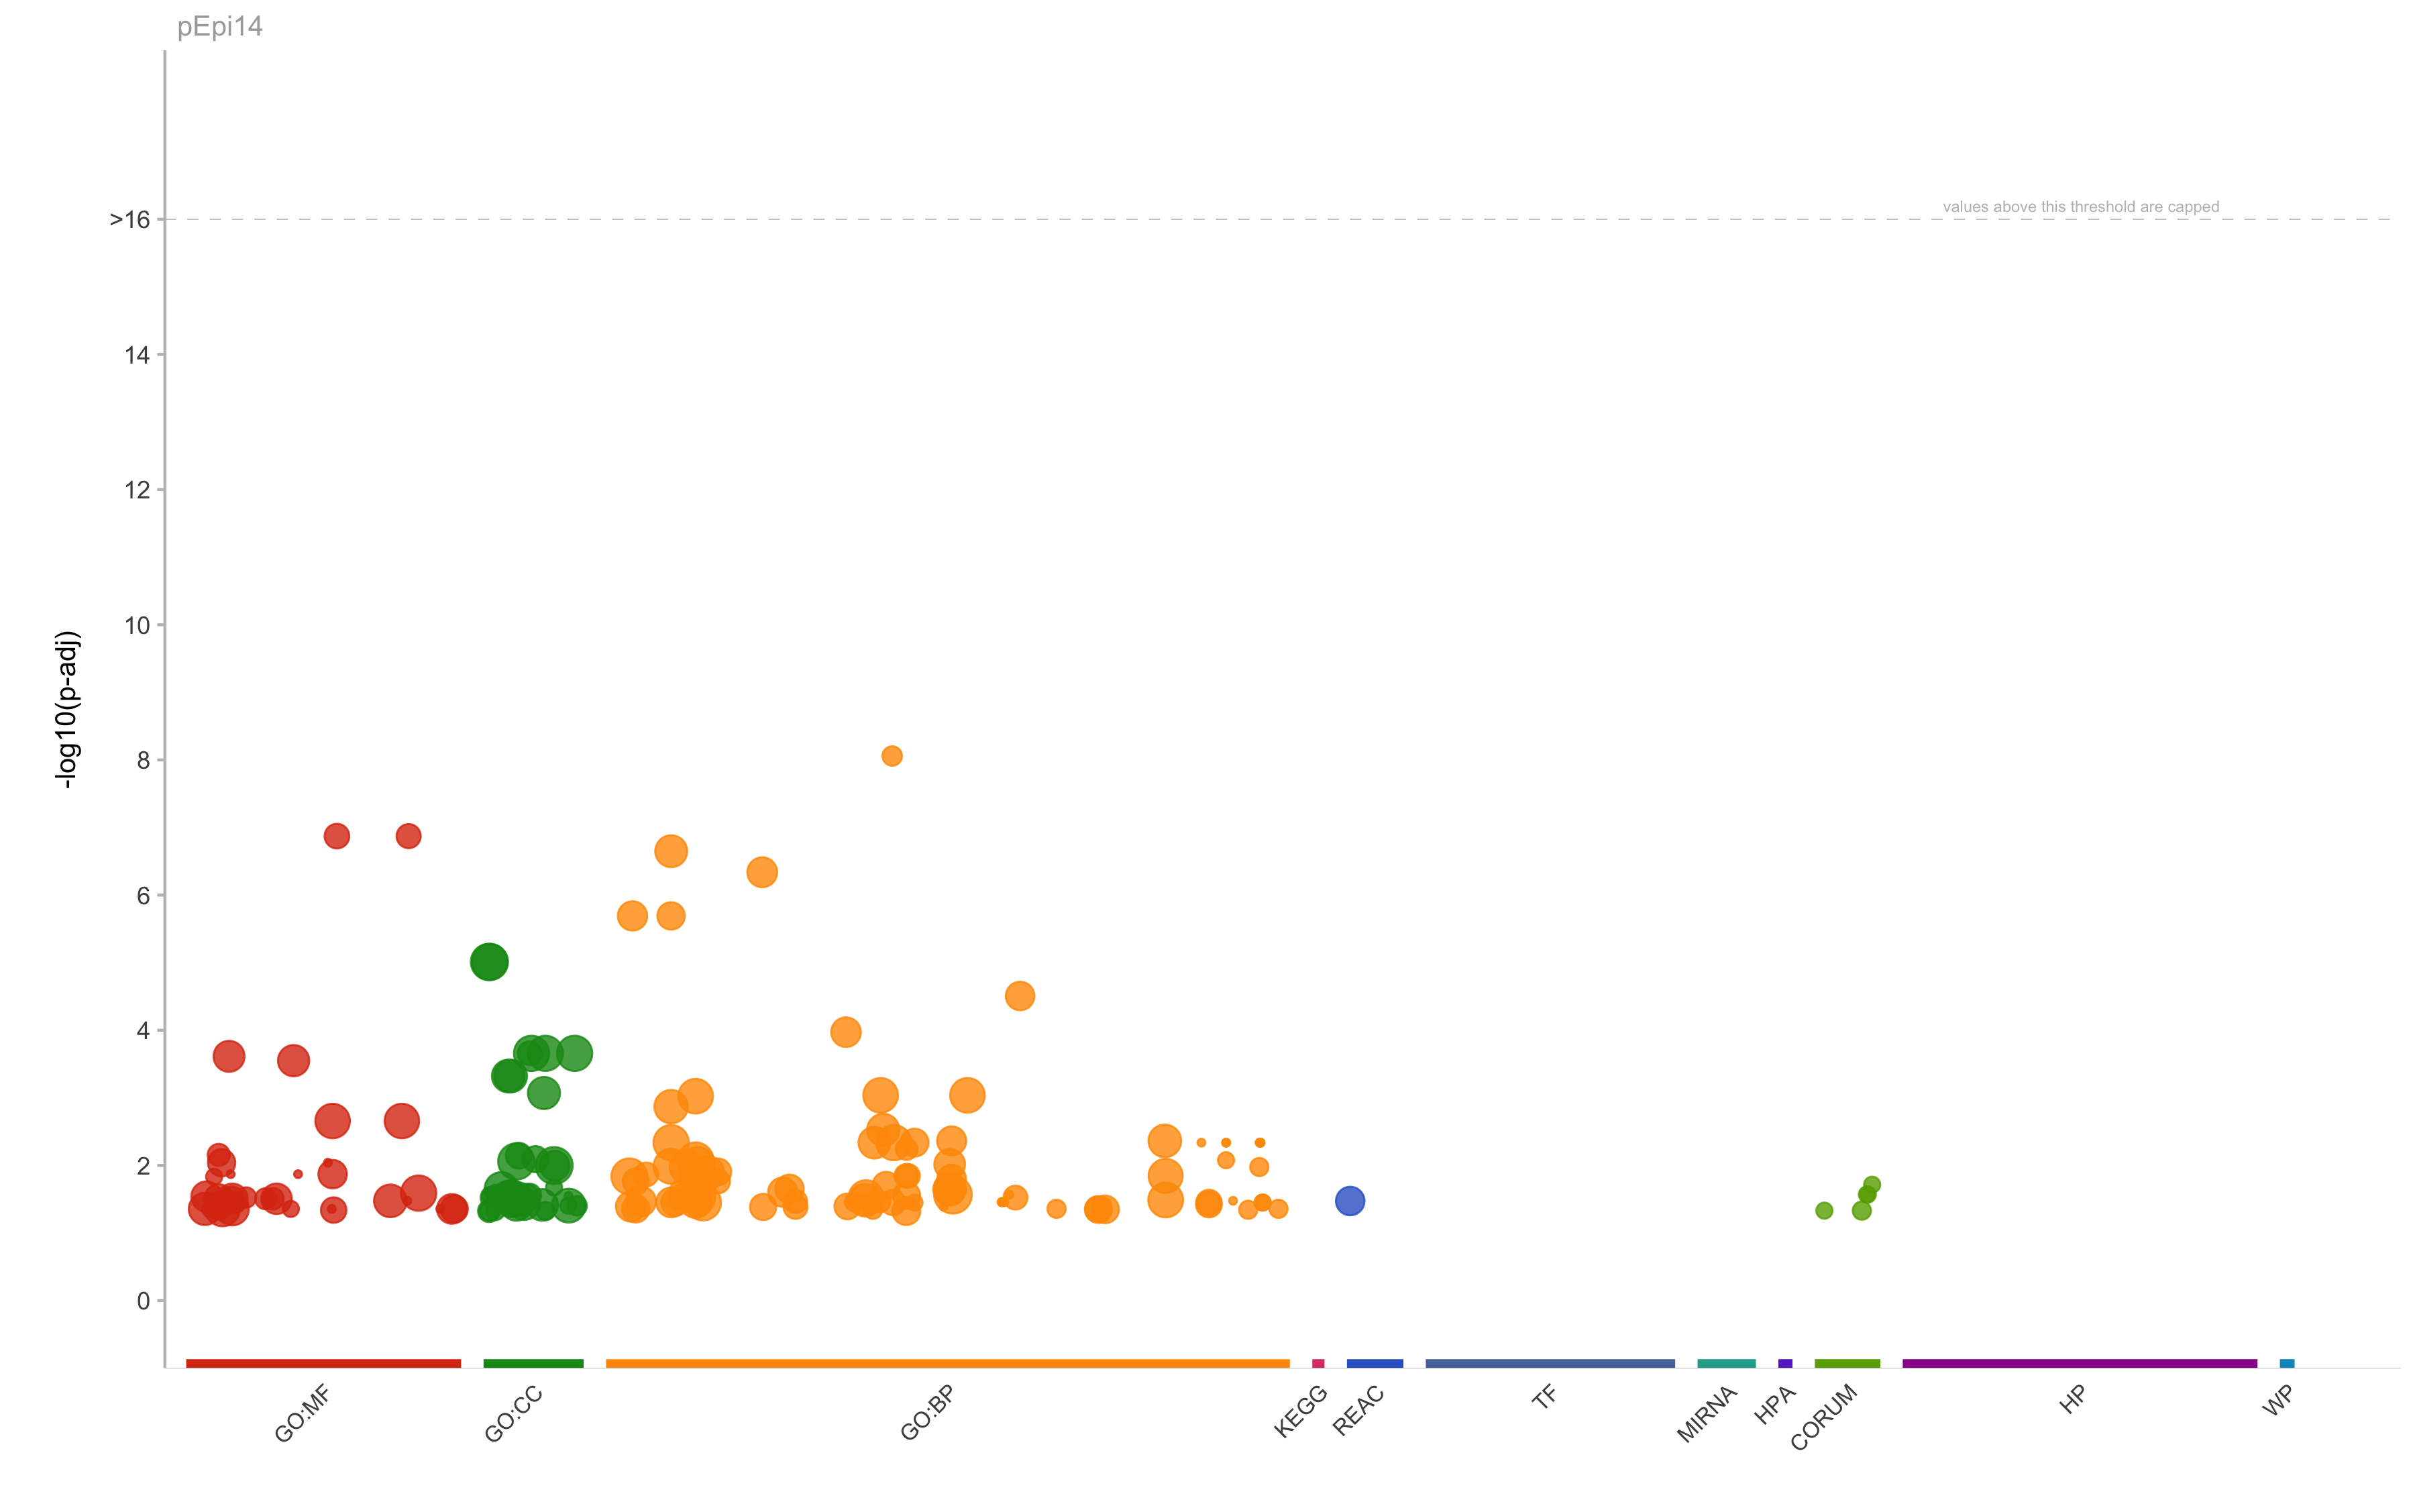
|
GO:BP
|
GO:0044278
|
cell wall disruption in other organism
|
8.75959527894717e-09
|
4
|
3
|
3
|
1
|
0.75
|
|
GO:BP
|
GO:0006959
|
humoral immune response
|
2.24387378238768e-07
|
384
|
10
|
7
|
0.7
|
0.0182291666666667
|
|
GO:BP
|
GO:0019730
|
antimicrobial humoral response
|
4.59544357692926e-07
|
145
|
7
|
5
|
0.714285714285714
|
0.0344827586206897
|
|
GO:BP
|
GO:0006953
|
acute-phase response
|
2.03458160619163e-06
|
50
|
89
|
7
|
0.0786516853932584
|
0.14
|
|
GO:BP
|
GO:0002526
|
acute inflammatory response
|
2.03458160619163e-06
|
114
|
89
|
9
|
0.101123595505618
|
0.0789473684210526
|
|
GO:BP
|
GO:0061844
|
antimicrobial humoral immune response mediated by antimicrobial peptide
|
3.11403612166571e-05
|
81
|
3
|
3
|
1
|
0.037037037037037
|
|
GO:BP
|
GO:0035821
|
modulation of process of other organism
|
0.000106796985640924
|
128
|
3
|
3
|
1
|
0.0234375
|
|
GO:BP
|
GO:0051707
|
response to other organism
|
0.000918724826439679
|
1592
|
10
|
7
|
0.7
|
0.00439698492462312
|
|
GO:BP
|
GO:0043207
|
response to external biotic stimulus
|
0.000918724826439679
|
1594
|
10
|
7
|
0.7
|
0.00439146800501882
|
|
GO:BP
|
GO:0009607
|
response to biotic stimulus
|
0.00094577790491426
|
1626
|
10
|
7
|
0.7
|
0.0043050430504305
|
|
GO:BP
|
GO:0006954
|
inflammatory response
|
0.00135075239456099
|
794
|
89
|
15
|
0.168539325842697
|
0.0188916876574307
|
|
GO:BP
|
GO:0043434
|
response to peptide hormone
|
0.00297983547216088
|
462
|
3
|
3
|
1
|
0.00649350649350649
|
|
GO:BP
|
GO:0050830
|
defense response to Gram-positive bacterium
|
0.00433741918677805
|
101
|
63
|
5
|
0.0793650793650794
|
0.0495049504950495
|
|
GO:BP
|
GO:1901652
|
response to peptide
|
0.00433741918677805
|
551
|
3
|
3
|
1
|
0.00544464609800363
|
|
GO:BP
|
GO:0042742
|
defense response to bacterium
|
0.00460680788550353
|
349
|
67
|
8
|
0.119402985074627
|
0.0229226361031519
|
|
GO:BP
|
GO:0006955
|
immune response
|
0.00460680788550353
|
2311
|
10
|
7
|
0.7
|
0.00302899177845089
|
|
GO:BP
|
GO:0045995
|
regulation of embryonic development
|
0.00460680788550353
|
63
|
21
|
3
|
0.142857142857143
|
0.0476190476190476
|
|
GO:BP
|
GO:0044419
|
biological process involved in interspecies interaction between organisms
|
0.00460680788550353
|
2255
|
10
|
7
|
0.7
|
0.00310421286031042
|
|
GO:BP
|
GO:0009605
|
response to external stimulus
|
0.00839053663851787
|
2944
|
27
|
13
|
0.481481481481481
|
0.00441576086956522
|
|
GO:BP
|
GO:0009725
|
response to hormone
|
0.00947358843020161
|
921
|
3
|
3
|
1
|
0.00325732899022801
|
|
GO:BP
|
GO:0006952
|
defense response
|
0.0103197947175024
|
1818
|
89
|
21
|
0.235955056179775
|
0.0115511551155116
|
|
GO:BP
|
GO:0008284
|
positive regulation of cell population proliferation
|
0.0104415610031657
|
982
|
3
|
3
|
1
|
0.00305498981670061
|
|
GO:BP
|
GO:0010837
|
regulation of keratinocyte proliferation
|
0.0124338666822228
|
39
|
53
|
3
|
0.0566037735849057
|
0.0769230769230769
|
|
GO:BP
|
GO:0010243
|
response to organonitrogen compound
|
0.0129139105947518
|
1085
|
3
|
3
|
1
|
0.00276497695852535
|
|
GO:BP
|
GO:0009617
|
response to bacterium
|
0.013429116384261
|
743
|
75
|
11
|
0.146666666666667
|
0.0148048452220727
|
|
GO:BP
|
GO:1901698
|
response to nitrogen compound
|
0.0142941821147209
|
1172
|
3
|
3
|
1
|
0.00255972696245734
|
|
GO:BP
|
GO:0002376
|
immune system process
|
0.0145280947516046
|
3278
|
12
|
8
|
0.666666666666667
|
0.0024405125076266
|
|
GO:BP
|
GO:0050829
|
defense response to Gram-negative bacterium
|
0.015917232117308
|
88
|
67
|
4
|
0.0597014925373134
|
0.0454545454545455
|
|
GO:BP
|
GO:0002675
|
positive regulation of acute inflammatory response
|
0.0172194277833513
|
29
|
87
|
3
|
0.0344827586206897
|
0.103448275862069
|
|
GO:BP
|
GO:0043616
|
keratinocyte proliferation
|
0.019834105487405
|
50
|
53
|
3
|
0.0566037735849057
|
0.06
|
|
GO:BP
|
GO:0050673
|
epithelial cell proliferation
|
0.0227883736218529
|
460
|
56
|
7
|
0.125
|
0.0152173913043478
|
|
GO:BP
|
GO:0030449
|
regulation of complement activation
|
0.0248615420267135
|
110
|
27
|
3
|
0.111111111111111
|
0.0272727272727273
|
|
GO:BP
|
GO:0050896
|
response to stimulus
|
0.0271726119073839
|
9407
|
46
|
35
|
0.760869565217391
|
0.00372063357074519
|
|
GO:BP
|
GO:0008283
|
cell population proliferation
|
0.0271726119073839
|
2054
|
19
|
8
|
0.421052631578947
|
0.00389483933787731
|
|
GO:BP
|
GO:0045616
|
regulation of keratinocyte differentiation
|
0.0277249383214701
|
43
|
73
|
3
|
0.0410958904109589
|
0.0697674418604651
|
|
GO:BP
|
GO:0042127
|
regulation of cell population proliferation
|
0.0299448834065193
|
1774
|
56
|
14
|
0.25
|
0.00789177001127396
|
|
GO:BP
|
GO:0009719
|
response to endogenous stimulus
|
0.0299448834065193
|
1683
|
3
|
3
|
1
|
0.0017825311942959
|
|
GO:BP
|
GO:1901700
|
response to oxygen-containing compound
|
0.0324765554109302
|
1739
|
3
|
3
|
1
|
0.00172512938470385
|
|
GO:BP
|
GO:0042060
|
wound healing
|
0.032718671662134
|
549
|
83
|
9
|
0.108433734939759
|
0.0163934426229508
|
|
GO:BP
|
GO:0009611
|
response to wounding
|
0.0341301085702194
|
674
|
83
|
10
|
0.120481927710843
|
0.0148367952522255
|
|
GO:BP
|
GO:0002920
|
regulation of humoral immune response
|
0.0341301085702194
|
133
|
27
|
3
|
0.111111111111111
|
0.0225563909774436
|
|
GO:BP
|
GO:0006958
|
complement activation, classical pathway
|
0.0352275343334209
|
142
|
27
|
3
|
0.111111111111111
|
0.0211267605633803
|
|
GO:BP
|
GO:0010033
|
response to organic substance
|
0.0353188604554684
|
3412
|
4
|
4
|
1
|
0.00117233294255569
|
|
GO:BP
|
GO:0002455
|
humoral immune response mediated by circulating immunoglobulin
|
0.0406586050965503
|
156
|
27
|
3
|
0.111111111111111
|
0.0192307692307692
|
|
GO:BP
|
GO:0002673
|
regulation of acute inflammatory response
|
0.0438939964016447
|
50
|
87
|
3
|
0.0344827586206897
|
0.06
|
|
GO:BP
|
GO:0045604
|
regulation of epidermal cell differentiation
|
0.0473734182299414
|
63
|
73
|
3
|
0.0410958904109589
|
0.0476190476190476
|
|
GO:CC
|
GO:0005576
|
extracellular region
|
9.75803188186204e-06
|
4567
|
73
|
39
|
0.534246575342466
|
0.00853952266257937
|
|
GO:CC
|
GO:0005615
|
extracellular space
|
9.75803188186204e-06
|
3594
|
73
|
34
|
0.465753424657534
|
0.00946021146355036
|
|
GO:CC
|
GO:0043230
|
extracellular organelle
|
0.000219630714793287
|
2263
|
11
|
8
|
0.727272727272727
|
0.00353513035793195
|
|
GO:CC
|
GO:0070062
|
extracellular exosome
|
0.000219630714793287
|
2176
|
11
|
8
|
0.727272727272727
|
0.00367647058823529
|
|
GO:CC
|
GO:1903561
|
extracellular vesicle
|
0.000219630714793287
|
2261
|
11
|
8
|
0.727272727272727
|
0.00353825740822645
|
|
GO:CC
|
GO:0031012
|
extracellular matrix
|
0.000475940253246927
|
562
|
90
|
12
|
0.133333333333333
|
0.0213523131672598
|
|
GO:CC
|
GO:0030312
|
external encapsulating structure
|
0.000475940253246927
|
563
|
90
|
12
|
0.133333333333333
|
0.0213143872113677
|
|
GO:CC
|
GO:0062023
|
collagen-containing extracellular matrix
|
0.000848884732831193
|
421
|
89
|
10
|
0.112359550561798
|
0.0237529691211401
|
|
GO:CC
|
GO:0031982
|
vesicle
|
0.00874098512868588
|
4055
|
11
|
8
|
0.727272727272727
|
0.00197287299630086
|
|
GO:CC
|
GO:0071944
|
cell periphery
|
0.0100537910839177
|
6169
|
43
|
25
|
0.581395348837209
|
0.00405252066785541
|
|
GO:CC
|
GO:0072562
|
blood microparticle
|
0.0100948890596984
|
140
|
89
|
5
|
0.0561797752808989
|
0.0357142857142857
|
|
GO:CC
|
GO:0009986
|
cell surface
|
0.0222542287836367
|
899
|
46
|
8
|
0.173913043478261
|
0.00889877641824249
|
|
GO:CC
|
GO:0031225
|
anchored component of membrane
|
0.0275070272910969
|
174
|
59
|
4
|
0.0677966101694915
|
0.0229885057471264
|
|
GO:CC
|
GO:0030141
|
secretory granule
|
0.0301727660875518
|
851
|
7
|
3
|
0.428571428571429
|
0.00352526439482961
|
|
GO:CC
|
GO:0035580
|
specific granule lumen
|
0.0301727660875518
|
61
|
88
|
3
|
0.0340909090909091
|
0.0491803278688525
|
|
GO:CC
|
GO:0031093
|
platelet alpha granule lumen
|
0.0361678539271212
|
66
|
89
|
3
|
0.0337078651685393
|
0.0454545454545455
|
|
GO:CC
|
GO:0034774
|
secretory granule lumen
|
0.0374766478483717
|
320
|
89
|
6
|
0.0674157303370786
|
0.01875
|
|
GO:CC
|
GO:0060205
|
cytoplasmic vesicle lumen
|
0.038363743023368
|
324
|
89
|
6
|
0.0674157303370786
|
0.0185185185185185
|
|
GO:CC
|
GO:0031983
|
vesicle lumen
|
0.038363743023368
|
326
|
89
|
6
|
0.0674157303370786
|
0.0184049079754601
|
|
GO:CC
|
GO:0099503
|
secretory vesicle
|
0.0393673835933609
|
1020
|
7
|
3
|
0.428571428571429
|
0.00294117647058824
|
|
GO:MF
|
GO:0070492
|
oligosaccharide binding
|
1.34183093298977e-07
|
15
|
3
|
3
|
1
|
0.2
|
|
GO:MF
|
GO:0042834
|
peptidoglycan binding
|
1.34183093298977e-07
|
18
|
3
|
3
|
1
|
0.166666666666667
|
|
GO:MF
|
GO:0005539
|
glycosaminoglycan binding
|
0.000243221765836984
|
238
|
3
|
3
|
1
|
0.0126050420168067
|
|
GO:MF
|
GO:0030246
|
carbohydrate binding
|
0.000281885215467858
|
275
|
3
|
3
|
1
|
0.0109090909090909
|
|
GO:MF
|
GO:0060089
|
molecular transducer activity
|
0.00220172200184767
|
1458
|
4
|
4
|
1
|
0.00274348422496571
|
|
GO:MF
|
GO:0038023
|
signaling receptor activity
|
0.00220172200184767
|
1458
|
4
|
4
|
1
|
0.00274348422496571
|
|
GO:MF
|
GO:0038024
|
cargo receptor activity
|
0.0134795633490857
|
78
|
36
|
3
|
0.0833333333333333
|
0.0384615384615385
|
|
GO:MF
|
GO:0097367
|
carbohydrate derivative binding
|
0.0257190549167166
|
2285
|
5
|
4
|
0.8
|
0.00175054704595186
|
|
GO:MF
|
GO:0004252
|
serine-type endopeptidase activity
|
0.0288607003884992
|
171
|
51
|
4
|
0.0784313725490196
|
0.0233918128654971
|
|
GO:MF
|
GO:0004896
|
cytokine receptor activity
|
0.0311574630717422
|
99
|
43
|
3
|
0.0697674418604651
|
0.0303030303030303
|
|
GO:MF
|
GO:0008236
|
serine-type peptidase activity
|
0.0311574630717422
|
189
|
51
|
4
|
0.0784313725490196
|
0.0211640211640212
|
|
GO:MF
|
GO:0017171
|
serine hydrolase activity
|
0.0311574630717422
|
193
|
51
|
4
|
0.0784313725490196
|
0.0207253886010363
|
|
GO:MF
|
GO:0050839
|
cell adhesion molecule binding
|
0.0334520239880056
|
546
|
32
|
5
|
0.15625
|
0.00915750915750916
|
|
GO:MF
|
GO:0005102
|
signaling receptor binding
|
0.0440299616665606
|
1672
|
18
|
6
|
0.333333333333333
|
0.00358851674641148
|
|
GO:MF
|
GO:0008233
|
peptidase activity
|
0.0440299616665606
|
646
|
30
|
5
|
0.166666666666667
|
0.00773993808049536
|
|
GO:MF
|
GO:0004175
|
endopeptidase activity
|
0.0440299616665606
|
450
|
28
|
4
|
0.142857142857143
|
0.00888888888888889
|
|
GO:MF
|
GO:0140375
|
immune receptor activity
|
0.0440299616665606
|
133
|
43
|
3
|
0.0697674418604651
|
0.0225563909774436
|
|
REAC
|
REAC:R-HSA-6803157
|
Antimicrobial peptides
|
0.0336430042133693
|
80
|
67
|
5
|
0.0746268656716418
|
0.0625
|
