|
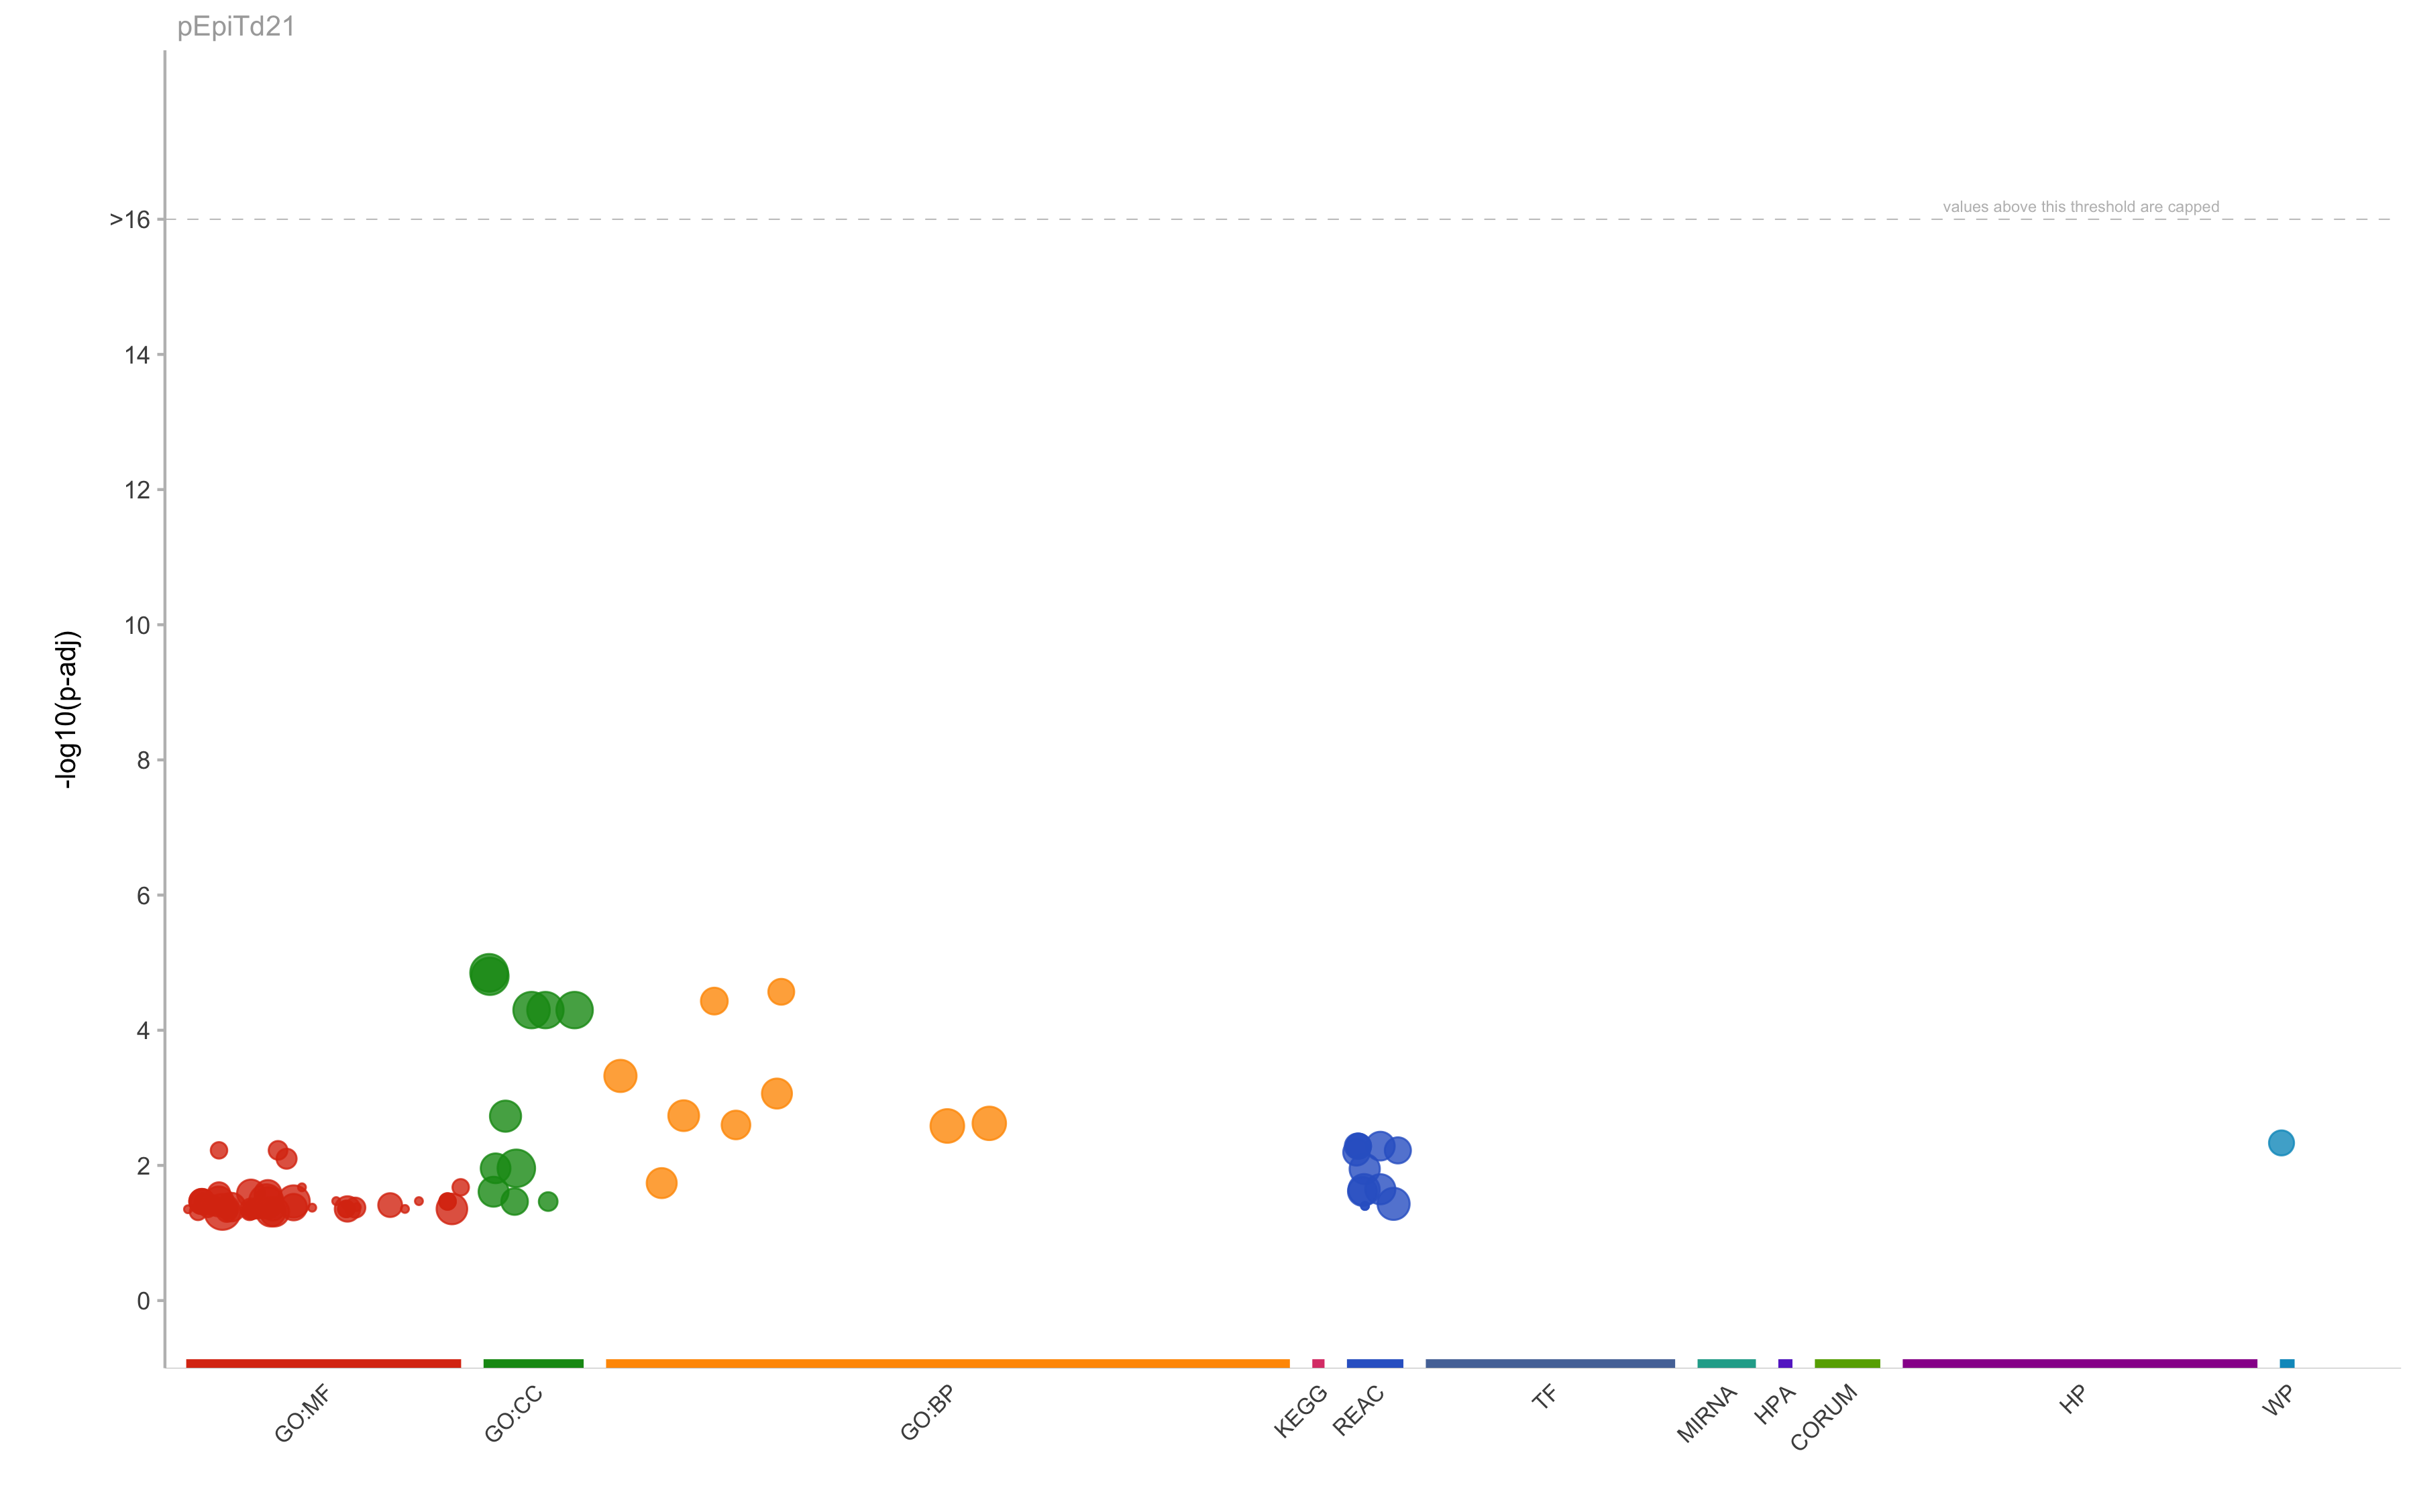
GO:BP
|
GO:0030277
|
maintenance of gastrointestinal epithelium
|
2.69781490716241e-05
|
21
|
5
|
3
|
0.6
|
0.142857142857143
|
|
GO:BP
|
GO:0010669
|
epithelial structure maintenance
|
3.70348933052736e-05
|
29
|
5
|
3
|
0.6
|
0.103448275862069
|
|
GO:BP
|
GO:0001894
|
tissue homeostasis
|
0.000474364187074315
|
270
|
6
|
4
|
0.666666666666667
|
0.0148148148148148
|
|
GO:BP
|
GO:0022600
|
digestive system process
|
0.000864870549035123
|
102
|
5
|
3
|
0.6
|
0.0294117647058824
|
|
GO:BP
|
GO:0007586
|
digestion
|
0.00183684471533182
|
141
|
5
|
3
|
0.6
|
0.0212765957446809
|
|
GO:BP
|
GO:0060249
|
anatomical structure homeostasis
|
0.00238685166337595
|
482
|
6
|
4
|
0.666666666666667
|
0.00829875518672199
|
|
GO:BP
|
GO:0016266
|
O-glycan processing
|
0.00252084380093978
|
58
|
41
|
4
|
0.0975609756097561
|
0.0689655172413793
|
|
GO:BP
|
GO:0048871
|
multicellular organismal homeostasis
|
0.00260863008418592
|
530
|
6
|
4
|
0.666666666666667
|
0.00754716981132075
|
|
GO:BP
|
GO:0006493
|
protein O-linked glycosylation
|
0.0182770982051589
|
102
|
41
|
4
|
0.0975609756097561
|
0.0392156862745098
|
|
GO:CC
|
GO:0005576
|
extracellular region
|
1.41581861051962e-05
|
4567
|
40
|
26
|
0.65
|
0.00569301510838625
|
|
GO:CC
|
GO:0005615
|
extracellular space
|
1.59147968561526e-05
|
3594
|
18
|
14
|
0.777777777777778
|
0.00389538119087368
|
|
GO:CC
|
GO:0043230
|
extracellular organelle
|
5.03314764995808e-05
|
2263
|
21
|
12
|
0.571428571428571
|
0.00530269553689792
|
|
GO:CC
|
GO:1903561
|
extracellular vesicle
|
5.03314764995808e-05
|
2261
|
21
|
12
|
0.571428571428571
|
0.00530738611233967
|
|
GO:CC
|
GO:0070062
|
extracellular exosome
|
5.03314764995808e-05
|
2176
|
21
|
12
|
0.571428571428571
|
0.00551470588235294
|
|
GO:CC
|
GO:0019814
|
immunoglobulin complex
|
0.00186814240471218
|
167
|
104
|
7
|
0.0673076923076923
|
0.0419161676646707
|
|
GO:CC
|
GO:0031982
|
vesicle
|
0.0110402417863043
|
4055
|
18
|
11
|
0.611111111111111
|
0.00271270036991369
|
|
GO:CC
|
GO:0005902
|
microvillus
|
0.0110402417863043
|
91
|
66
|
4
|
0.0606060606060606
|
0.043956043956044
|
|
GO:MF
|
GO:0004896
|
cytokine receptor activity
|
0.0341736875732192
|
99
|
92
|
4
|
0.0434782608695652
|
0.0404040404040404
|
|
GO:MF
|
GO:0016491
|
oxidoreductase activity
|
0.0341736875732192
|
771
|
22
|
5
|
0.227272727272727
|
0.00648508430609598
|
|
GO:MF
|
GO:0030246
|
carbohydrate binding
|
0.0341736875732192
|
275
|
33
|
4
|
0.121212121212121
|
0.0145454545454545
|
|
GO:MF
|
GO:0008146
|
sulfotransferase activity
|
0.0414118337656584
|
56
|
93
|
3
|
0.032258064516129
|
0.0535714285714286
|
|
GO:MF
|
GO:0140375
|
immune receptor activity
|
0.0440753413860695
|
133
|
92
|
4
|
0.0434782608695652
|
0.0300751879699248
|
|
GO:MF
|
GO:0016782
|
transferase activity, transferring sulfur-containing groups
|
0.0487359299212589
|
74
|
93
|
3
|
0.032258064516129
|
0.0405405405405405
|
|
GO:MF
|
GO:0005102
|
signaling receptor binding
|
0.0487359299212589
|
1672
|
5
|
3
|
0.6
|
0.00179425837320574
|
|
REAC
|
REAC:R-HSA-913709
|
O-linked glycosylation of mucins
|
0.00518531060405489
|
61
|
41
|
4
|
0.0975609756097561
|
0.0655737704918033
|
|
REAC
|
REAC:R-HSA-5173105
|
O-linked glycosylation
|
0.0225371390404893
|
107
|
41
|
4
|
0.0975609756097561
|
0.0373831775700935
|
|
WP
|
WP:WP2291
|
Deregulation of Rab and Rab Effector Genes in Bladder Cancer
|
0.0046475195804322
|
16
|
37
|
3
|
0.0810810810810811
|
0.1875
|