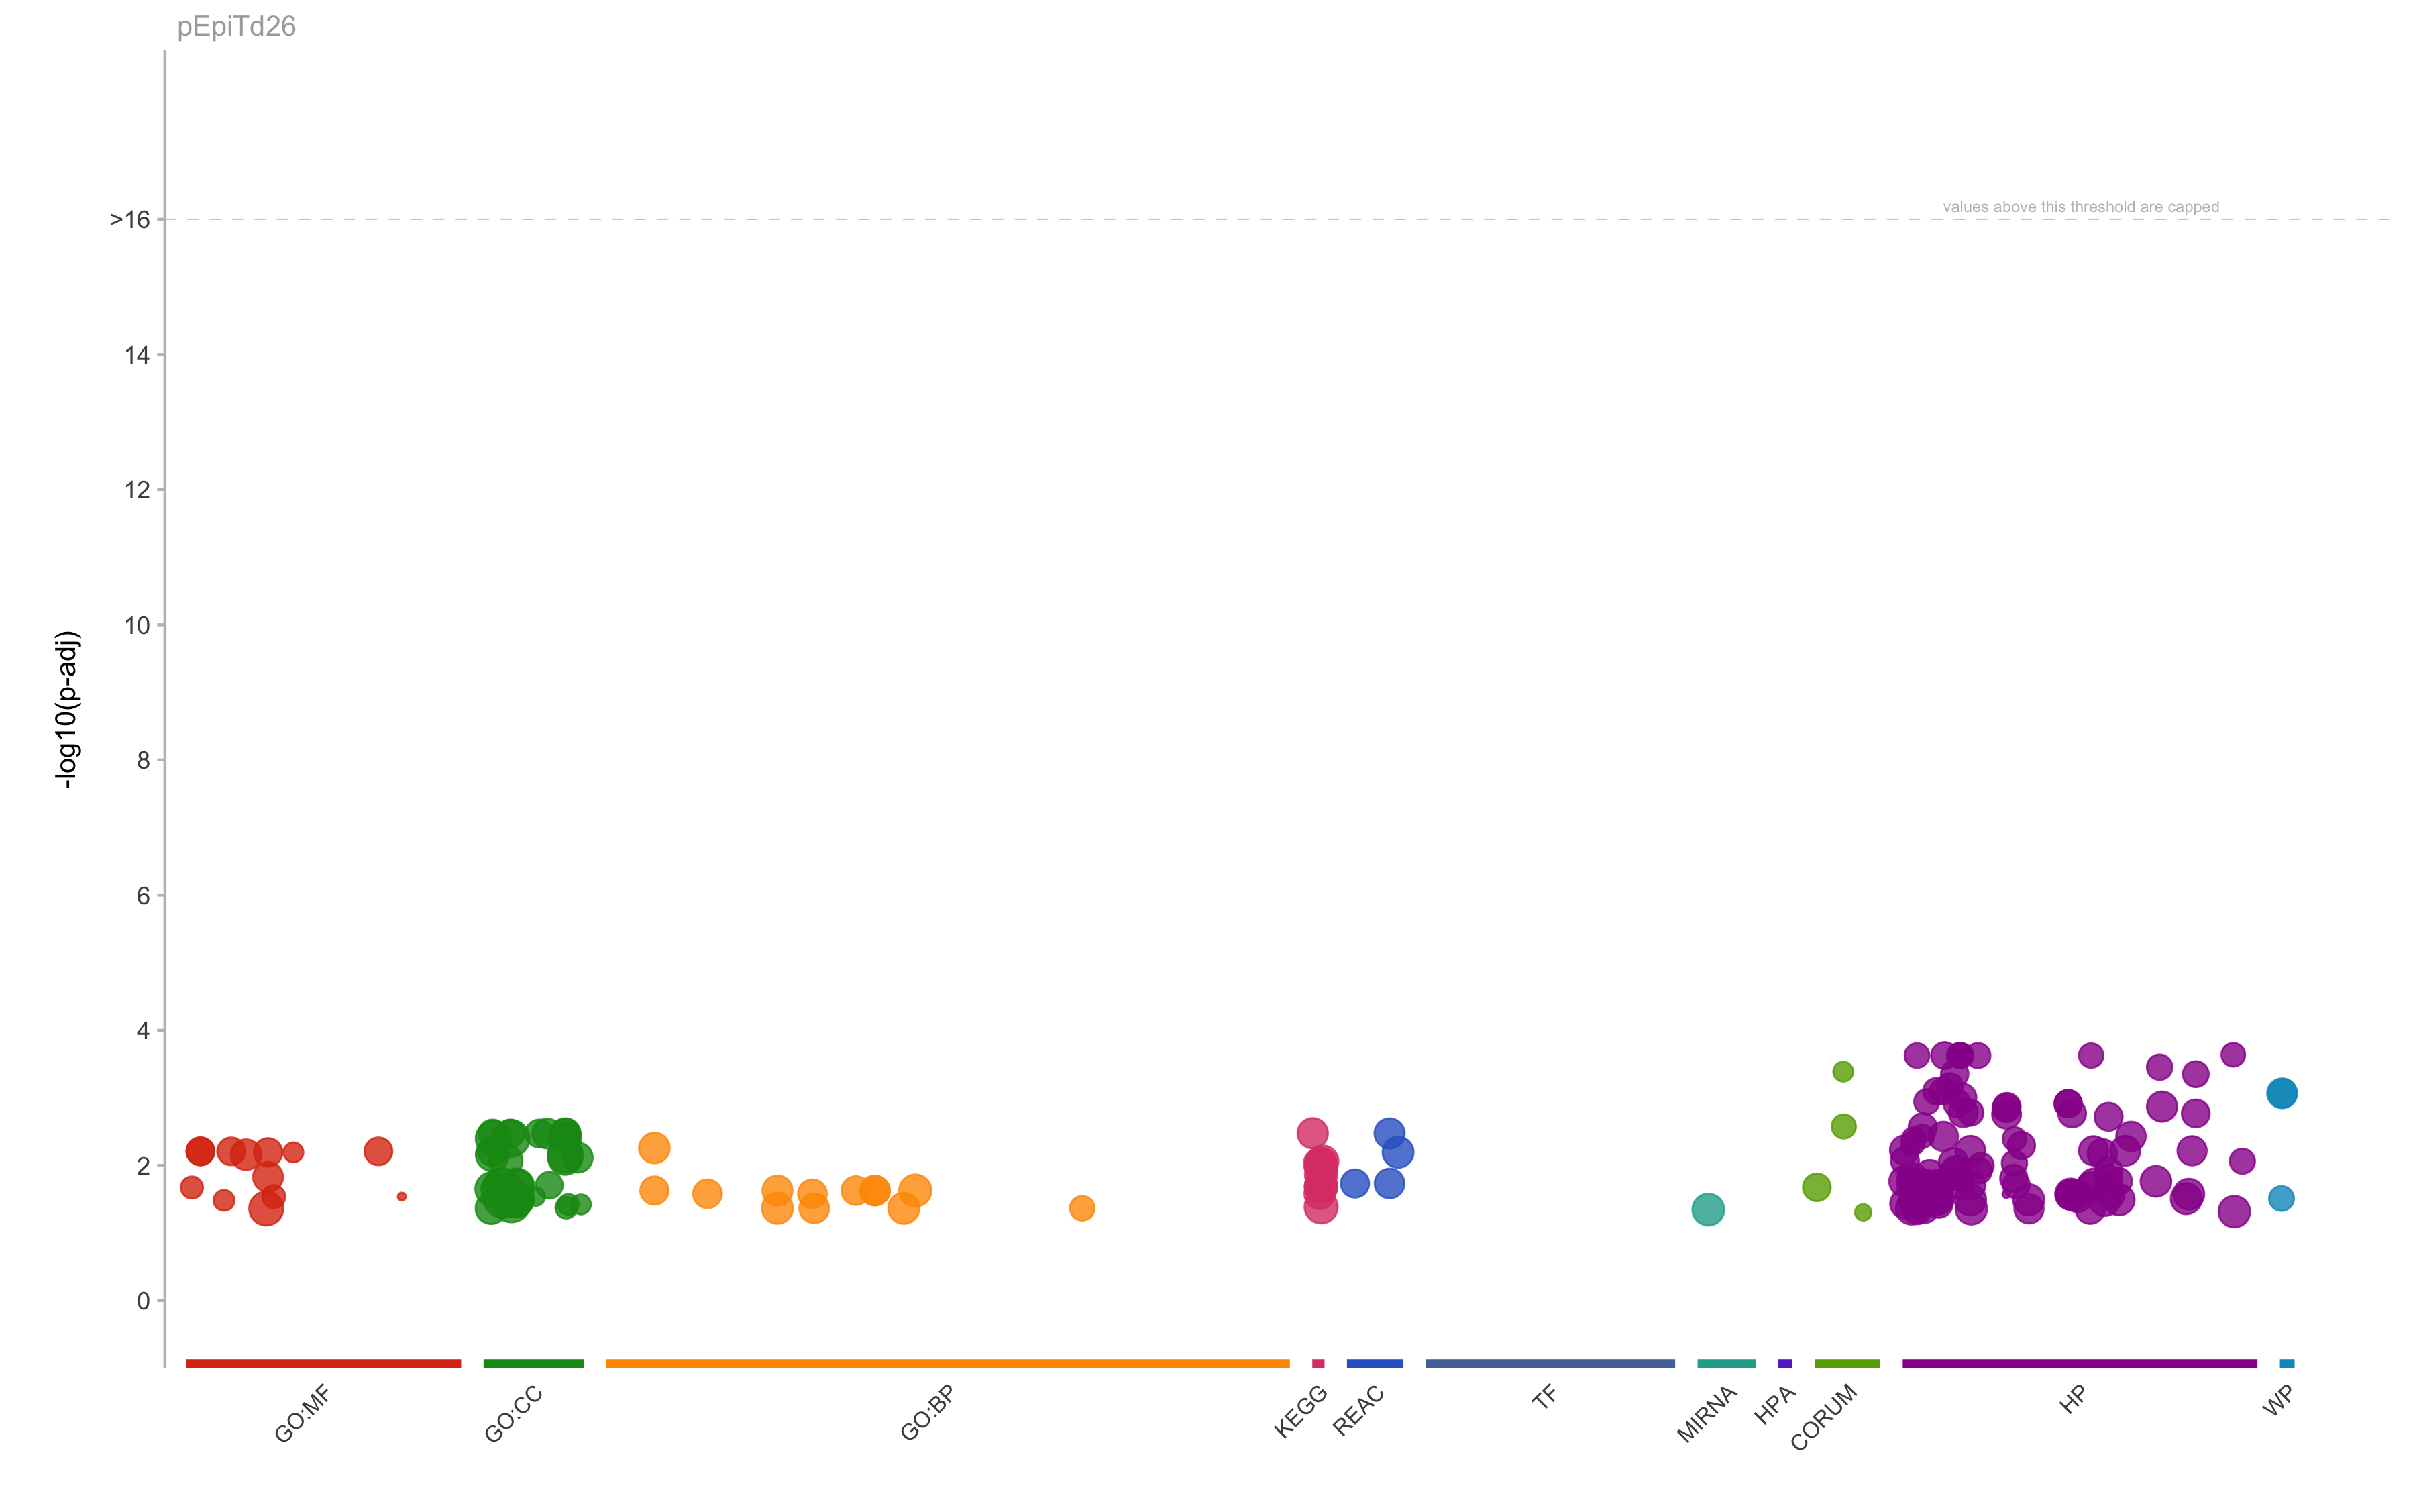
|
GO:BP
|
GO:0006119
|
oxidative phosphorylation
|
0.00552612587029198
|
151
|
13
|
4
|
0.307692307692308
|
0.0264900662251656
|
|
GO:BP
|
GO:0036498
|
IRE1-mediated unfolded protein response
|
0.0235477473445267
|
67
|
24
|
3
|
0.125
|
0.0447761194029851
|
|
GO:BP
|
GO:0042773
|
ATP synthesis coupled electron transport
|
0.0235477473445267
|
100
|
13
|
3
|
0.230769230769231
|
0.03
|
|
GO:BP
|
GO:0042775
|
mitochondrial ATP synthesis coupled electron transport
|
0.0235477473445267
|
99
|
13
|
3
|
0.230769230769231
|
0.0303030303030303
|
|
GO:BP
|
GO:0022904
|
respiratory electron transport chain
|
0.0235477473445267
|
117
|
13
|
3
|
0.230769230769231
|
0.0256410256410256
|
|
GO:BP
|
GO:0046034
|
ATP metabolic process
|
0.0235477473445267
|
314
|
13
|
4
|
0.307692307692308
|
0.0127388535031847
|
|
GO:BP
|
GO:0045333
|
cellular respiration
|
0.0430261247741565
|
192
|
13
|
3
|
0.230769230769231
|
0.015625
|
|
GO:BP
|
GO:0022900
|
electron transport chain
|
0.0430261247741565
|
180
|
13
|
3
|
0.230769230769231
|
0.0166666666666667
|
|
GO:CC
|
GO:0098800
|
inner mitochondrial membrane protein complex
|
0.00337575188880727
|
146
|
7
|
3
|
0.428571428571429
|
0.0205479452054795
|
|
GO:CC
|
GO:0098803
|
respiratory chain complex
|
0.00337575188880727
|
86
|
13
|
3
|
0.230769230769231
|
0.0348837209302326
|
|
GO:CC
|
GO:0070469
|
respirasome
|
0.00337575188880727
|
103
|
13
|
3
|
0.230769230769231
|
0.029126213592233
|
|
GO:CC
|
GO:0098798
|
mitochondrial protein-containing complex
|
0.00392850259540846
|
270
|
7
|
3
|
0.428571428571429
|
0.0111111111111111
|
|
GO:CC
|
GO:0031090
|
organelle membrane
|
0.00398562301816076
|
3612
|
21
|
12
|
0.571428571428571
|
0.00332225913621262
|
|
GO:CC
|
GO:0005794
|
Golgi apparatus
|
0.00398562301816076
|
1623
|
30
|
10
|
0.333333333333333
|
0.00616142945163278
|
|
GO:CC
|
GO:0098796
|
membrane protein complex
|
0.00691779773794588
|
1322
|
20
|
7
|
0.35
|
0.00529500756429652
|
|
GO:CC
|
GO:0005743
|
mitochondrial inner membrane
|
0.00691779773794588
|
503
|
13
|
4
|
0.307692307692308
|
0.00795228628230616
|
|
GO:CC
|
GO:0098791
|
Golgi apparatus subcompartment
|
0.00765797231192964
|
885
|
30
|
7
|
0.233333333333333
|
0.00790960451977401
|
|
GO:CC
|
GO:0019866
|
organelle inner membrane
|
0.00855564021525794
|
564
|
13
|
4
|
0.307692307692308
|
0.00709219858156028
|
|
GO:CC
|
GO:0031984
|
organelle subcompartment
|
0.020392526606752
|
1773
|
30
|
9
|
0.3
|
0.0050761421319797
|
|
GO:CC
|
GO:0031966
|
mitochondrial membrane
|
0.020392526606752
|
746
|
13
|
4
|
0.307692307692308
|
0.00536193029490617
|
|
GO:CC
|
GO:0012505
|
endomembrane system
|
0.0207297689365597
|
4640
|
21
|
12
|
0.571428571428571
|
0.00258620689655172
|
|
GO:CC
|
GO:0005740
|
mitochondrial envelope
|
0.022337431705993
|
797
|
13
|
4
|
0.307692307692308
|
0.00501882057716437
|
|
GO:CC
|
GO:0016021
|
integral component of membrane
|
0.0314888323518397
|
5711
|
21
|
13
|
0.619047619047619
|
0.00227630887760462
|
|
GO:CC
|
GO:0031967
|
organelle envelope
|
0.0320499599863315
|
1237
|
16
|
5
|
0.3125
|
0.00404203718674212
|
|
GO:CC
|
GO:0031975
|
envelope
|
0.0320499599863315
|
1237
|
16
|
5
|
0.3125
|
0.00404203718674212
|
|
GO:CC
|
GO:0031224
|
intrinsic component of membrane
|
0.0364521949602141
|
5868
|
21
|
13
|
0.619047619047619
|
0.00221540558963872
|
|
GO:CC
|
GO:0005681
|
spliceosomal complex
|
0.0431972047099237
|
191
|
67
|
4
|
0.0597014925373134
|
0.0209424083769634
|
|
GO:MF
|
GO:0009055
|
electron transfer activity
|
0.00693613504280653
|
148
|
13
|
3
|
0.230769230769231
|
0.0202702702702703
|
|
GO:MF
|
GO:0016491
|
oxidoreductase activity
|
0.0433873645564172
|
771
|
13
|
4
|
0.307692307692308
|
0.00518806744487678
|
|
HP
|
HP:0100611
|
Multiple glomerular cysts
|
0.000230661312493726
|
11
|
7
|
3
|
0.428571428571429
|
0.272727272727273
|
|
HP
|
HP:0003572
|
Low plasma citrulline
|
0.000230661312493726
|
11
|
7
|
3
|
0.428571428571429
|
0.272727272727273
|
|
HP
|
HP:0011965
|
Abnormal circulating citrulline concentration
|
0.000236697735839708
|
14
|
7
|
3
|
0.428571428571429
|
0.214285714285714
|
|
HP
|
HP:0002572
|
Episodic vomiting
|
0.000236697735839708
|
32
|
13
|
4
|
0.307692307692308
|
0.125
|
|
HP
|
HP:0003481
|
Segmental peripheral demyelination/remyelination
|
0.000236697735839708
|
17
|
7
|
3
|
0.428571428571429
|
0.176470588235294
|
|
HP
|
HP:0003648
|
Lacticaciduria
|
0.000236697735839708
|
14
|
7
|
3
|
0.428571428571429
|
0.214285714285714
|
|
HP
|
HP:0004885
|
Episodic respiratory distress
|
0.000236697735839708
|
17
|
7
|
3
|
0.428571428571429
|
0.176470588235294
|
|
HP
|
HP:0000816
|
Abnormality of Krebs cycle metabolism
|
0.000236697735839708
|
15
|
7
|
3
|
0.428571428571429
|
0.2
|
|
HP
|
HP:0031434
|
Abnormal speech prosody
|
0.000352017438213099
|
20
|
7
|
3
|
0.428571428571429
|
0.15
|
|
HP
|
HP:0003200
|
Ragged-red muscle fibers
|
0.000441582826519918
|
40
|
13
|
4
|
0.307692307692308
|
0.1
|
|
HP
|
HP:0033109
|
Abnormal circulating non-proteinogenic amino acid concentration
|
0.00044653347283252
|
23
|
7
|
3
|
0.428571428571429
|
0.130434782608696
|
|
HP
|
HP:0002883
|
Hyperventilation
|
0.000674228799534215
|
27
|
7
|
3
|
0.428571428571429
|
0.111111111111111
|
|
HP
|
HP:0002045
|
Hypothermia
|
0.000800545760395921
|
30
|
7
|
3
|
0.428571428571429
|
0.1
|
|
HP
|
HP:0002483
|
Bulbar signs
|
0.000800545760395921
|
30
|
7
|
3
|
0.428571428571429
|
0.1
|
|
HP
|
HP:0003737
|
Mitochondrial myopathy
|
0.000995947323287916
|
54
|
13
|
4
|
0.307692307692308
|
0.0740740740740741
|
|
HP
|
HP:0001427
|
Mitochondrial inheritance
|
0.00114237550694486
|
18
|
13
|
3
|
0.230769230769231
|
0.166666666666667
|
|
HP
|
HP:0010915
|
Abnormal circulating pyruvate family amino acid concentration
|
0.00121909454455533
|
38
|
7
|
3
|
0.428571428571429
|
0.0789473684210526
|
|
HP
|
HP:0010916
|
Abnormal circulating alanine concentration
|
0.00121909454455533
|
38
|
7
|
3
|
0.428571428571429
|
0.0789473684210526
|
|
HP
|
HP:0003348
|
Hyperalaninemia
|
0.00121909454455533
|
37
|
7
|
3
|
0.428571428571429
|
0.0810810810810811
|
|
HP
|
HP:0007183
|
Focal T2 hyperintense basal ganglia lesion
|
0.00134747041842147
|
40
|
7
|
3
|
0.428571428571429
|
0.075
|
|
HP
|
HP:0031546
|
Cardiac conduction abnormality
|
0.00134747041842147
|
123
|
14
|
5
|
0.357142857142857
|
0.040650406504065
|
|
HP
|
HP:0007108
|
Demyelinating peripheral neuropathy
|
0.00142891308952238
|
42
|
7
|
3
|
0.428571428571429
|
0.0714285714285714
|
|
HP
|
HP:0003800
|
Muscle abnormality related to mitochondrial dysfunction
|
0.00166078351226299
|
69
|
13
|
4
|
0.307692307692308
|
0.0579710144927536
|
|
HP
|
HP:0004309
|
Ventricular preexcitation
|
0.00166078351226299
|
23
|
13
|
3
|
0.230769230769231
|
0.130434782608696
|
|
HP
|
HP:0011096
|
Peripheral demyelination
|
0.00170203924681929
|
47
|
7
|
3
|
0.428571428571429
|
0.0638297872340425
|
|
HP
|
HP:0033108
|
Abnormal circulating proteinogenic amino acid derivative concentration
|
0.00170203924681929
|
47
|
7
|
3
|
0.428571428571429
|
0.0638297872340425
|
|
HP
|
HP:0007141
|
Sensorimotor neuropathy
|
0.00174828457837359
|
72
|
13
|
4
|
0.307692307692308
|
0.0555555555555556
|
|
HP
|
HP:0012751
|
Abnormal basal ganglia MRI signal intensity
|
0.00190654539579575
|
50
|
7
|
3
|
0.428571428571429
|
0.06
|
|
HP
|
HP:0001138
|
Optic neuropathy
|
0.00273513061463669
|
57
|
7
|
3
|
0.428571428571429
|
0.0526315789473684
|
|
HP
|
HP:0002490
|
Increased CSF lactate
|
0.0037159213741476
|
91
|
13
|
4
|
0.307692307692308
|
0.043956043956044
|
|
HP
|
HP:0030085
|
Abnormal CSF lactate level
|
0.0037159213741476
|
91
|
13
|
4
|
0.307692307692308
|
0.043956043956044
|
|
HP
|
HP:0008316
|
Abnormal mitochondria in muscle tissue
|
0.00507592918912862
|
38
|
13
|
3
|
0.230769230769231
|
0.0789473684210526
|
|
HP
|
HP:0000091
|
Abnormal renal tubule morphology
|
0.00592679463426331
|
80
|
7
|
3
|
0.428571428571429
|
0.0375
|
|
HP
|
HP:0012072
|
Aciduria
|
0.00607428608459127
|
83
|
7
|
3
|
0.428571428571429
|
0.036144578313253
|
|
HP
|
HP:0032943
|
Abnormal urine pH
|
0.00607428608459127
|
83
|
7
|
3
|
0.428571428571429
|
0.036144578313253
|
|
HP
|
HP:0025454
|
Abnormal CSF metabolite level
|
0.00607428608459127
|
110
|
13
|
4
|
0.307692307692308
|
0.0363636363636364
|
|
HP
|
HP:0004308
|
Ventricular arrhythmia
|
0.00607428608459127
|
106
|
24
|
5
|
0.208333333333333
|
0.0471698113207547
|
|
HP
|
HP:0012469
|
Infantile spasms
|
0.00670411815097994
|
87
|
7
|
3
|
0.428571428571429
|
0.0344827586206897
|
|
HP
|
HP:0000114
|
Proximal tubulopathy
|
0.00856787422467473
|
48
|
13
|
3
|
0.230769230769231
|
0.0625
|
|
HP
|
HP:0003130
|
Abnormal peripheral myelination
|
0.00918430795734435
|
99
|
7
|
3
|
0.428571428571429
|
0.0303030303030303
|
|
HP
|
HP:0003287
|
Abnormality of mitochondrial metabolism
|
0.0122550455168751
|
139
|
13
|
4
|
0.307692307692308
|
0.0287769784172662
|
|
HP
|
HP:0001644
|
Dilated cardiomyopathy
|
0.0140295747400638
|
145
|
13
|
4
|
0.307692307692308
|
0.0275862068965517
|
|
HP
|
HP:0003112
|
Abnormal circulating amino acid concentration
|
0.0140295747400638
|
120
|
7
|
3
|
0.428571428571429
|
0.025
|
|
HP
|
HP:0000580
|
Pigmentary retinopathy
|
0.0155504398829038
|
151
|
13
|
4
|
0.307692307692308
|
0.0264900662251656
|
|
HP
|
HP:0000095
|
Abnormal renal glomerulus morphology
|
0.0171883812466143
|
158
|
13
|
4
|
0.307692307692308
|
0.0253164556962025
|
|
HP
|
HP:0031263
|
Abnormal renal corpuscle morphology
|
0.0171883812466143
|
158
|
13
|
4
|
0.307692307692308
|
0.0253164556962025
|
|
HP
|
HP:0000543
|
Optic disc pallor
|
0.0187191824862431
|
139
|
7
|
3
|
0.428571428571429
|
0.0215827338129496
|
|
HP
|
HP:0012103
|
Abnormality of the mitochondrion
|
0.0187191824862431
|
163
|
13
|
4
|
0.307692307692308
|
0.0245398773006135
|
|
HP
|
HP:0001399
|
Hepatic failure
|
0.0194213942669108
|
143
|
7
|
3
|
0.428571428571429
|
0.020979020979021
|
|
HP
|
HP:0002123
|
Generalized myoclonic seizure
|
0.0196467710721413
|
146
|
7
|
3
|
0.428571428571429
|
0.0205479452054795
|
|
HP
|
HP:0002151
|
Increased serum lactate
|
0.0203417225225924
|
172
|
13
|
4
|
0.307692307692308
|
0.0232558139534884
|
|
HP
|
HP:0002098
|
Respiratory distress
|
0.0263701418324102
|
164
|
7
|
3
|
0.428571428571429
|
0.0182926829268293
|
|
HP
|
HP:0011035
|
Abnormal renal cortex morphology
|
0.0265751335816165
|
187
|
13
|
4
|
0.307692307692308
|
0.0213903743315508
|
|
HP
|
HP:0032794
|
Myoclonic seizure
|
0.0266379254014284
|
167
|
7
|
3
|
0.428571428571429
|
0.0179640718562874
|
|
HP
|
HP:0011097
|
Epileptic spasm
|
0.0272927013824631
|
170
|
7
|
3
|
0.428571428571429
|
0.0176470588235294
|
|
HP
|
HP:0011344
|
Severe global developmental delay
|
0.0289046193532768
|
175
|
7
|
3
|
0.428571428571429
|
0.0171428571428571
|
|
HP
|
HP:0032677
|
Generalized-onset motor seizure
|
0.0310507843273232
|
181
|
7
|
3
|
0.428571428571429
|
0.0165745856353591
|
|
HP
|
HP:0002134
|
Abnormality of the basal ganglia
|
0.0310562336735959
|
201
|
13
|
4
|
0.307692307692308
|
0.0199004975124378
|
|
HP
|
HP:0001410
|
Decreased liver function
|
0.0317483129315885
|
184
|
7
|
3
|
0.428571428571429
|
0.016304347826087
|
|
HP
|
HP:0008947
|
Infantile muscular hypotonia
|
0.0321745580986499
|
188
|
7
|
3
|
0.428571428571429
|
0.0159574468085106
|
|
HP
|
HP:0002066
|
Gait ataxia
|
0.0321745580986499
|
188
|
7
|
3
|
0.428571428571429
|
0.0159574468085106
|
|
HP
|
HP:0004303
|
Abnormal muscle fiber morphology
|
0.0321745580986499
|
205
|
13
|
4
|
0.307692307692308
|
0.0195121951219512
|
|
HP
|
HP:0025155
|
Abnormality of hepatobiliary system physiology
|
0.0321745580986499
|
188
|
7
|
3
|
0.428571428571429
|
0.0159574468085106
|
|
HP
|
HP:0012575
|
Abnormal nephron morphology
|
0.0327543509795297
|
208
|
13
|
4
|
0.307692307692308
|
0.0192307692307692
|
|
HP
|
HP:0000124
|
Renal tubular dysfunction
|
0.0369002547272921
|
101
|
13
|
3
|
0.230769230769231
|
0.0297029702970297
|
|
HP
|
HP:0004354
|
Abnormal circulating carboxylic acid concentration
|
0.0438736363598052
|
214
|
7
|
3
|
0.428571428571429
|
0.014018691588785
|
|
HP
|
HP:0000510
|
Rod-cone dystrophy
|
0.0438736363598052
|
215
|
7
|
3
|
0.428571428571429
|
0.013953488372093
|
|
HP
|
HP:0100660
|
Dyskinesia
|
0.0482780582876144
|
226
|
7
|
3
|
0.428571428571429
|
0.0132743362831858
|
|
KEGG
|
KEGG:00190
|
Oxidative phosphorylation
|
0.00334464150350415
|
133
|
13
|
4
|
0.307692307692308
|
0.0300751879699248
|
|
KEGG
|
KEGG:05415
|
Diabetic cardiomyopathy
|
0.00865113824978457
|
203
|
13
|
4
|
0.307692307692308
|
0.0197044334975369
|
|
KEGG
|
KEGG:04714
|
Thermogenesis
|
0.00944050204342356
|
232
|
13
|
4
|
0.307692307692308
|
0.0172413793103448
|
|
KEGG
|
KEGG:05012
|
Parkinson disease
|
0.00944050204342356
|
249
|
13
|
4
|
0.307692307692308
|
0.0160642570281124
|
|
KEGG
|
KEGG:05020
|
Prion disease
|
0.0106984135693444
|
273
|
13
|
4
|
0.307692307692308
|
0.0146520146520147
|
|
KEGG
|
KEGG:05016
|
Huntington disease
|
0.0136854702542152
|
306
|
13
|
4
|
0.307692307692308
|
0.0130718954248366
|
|
KEGG
|
KEGG:05010
|
Alzheimer disease
|
0.0205504591472706
|
369
|
13
|
4
|
0.307692307692308
|
0.010840108401084
|
|
KEGG
|
KEGG:05014
|
Amyotrophic lateral sclerosis
|
0.0205504591472706
|
363
|
13
|
4
|
0.307692307692308
|
0.0110192837465565
|
|
KEGG
|
KEGG:05022
|
Pathways of neurodegeneration - multiple diseases
|
0.0410742407852524
|
475
|
13
|
4
|
0.307692307692308
|
0.00842105263157895
|
|
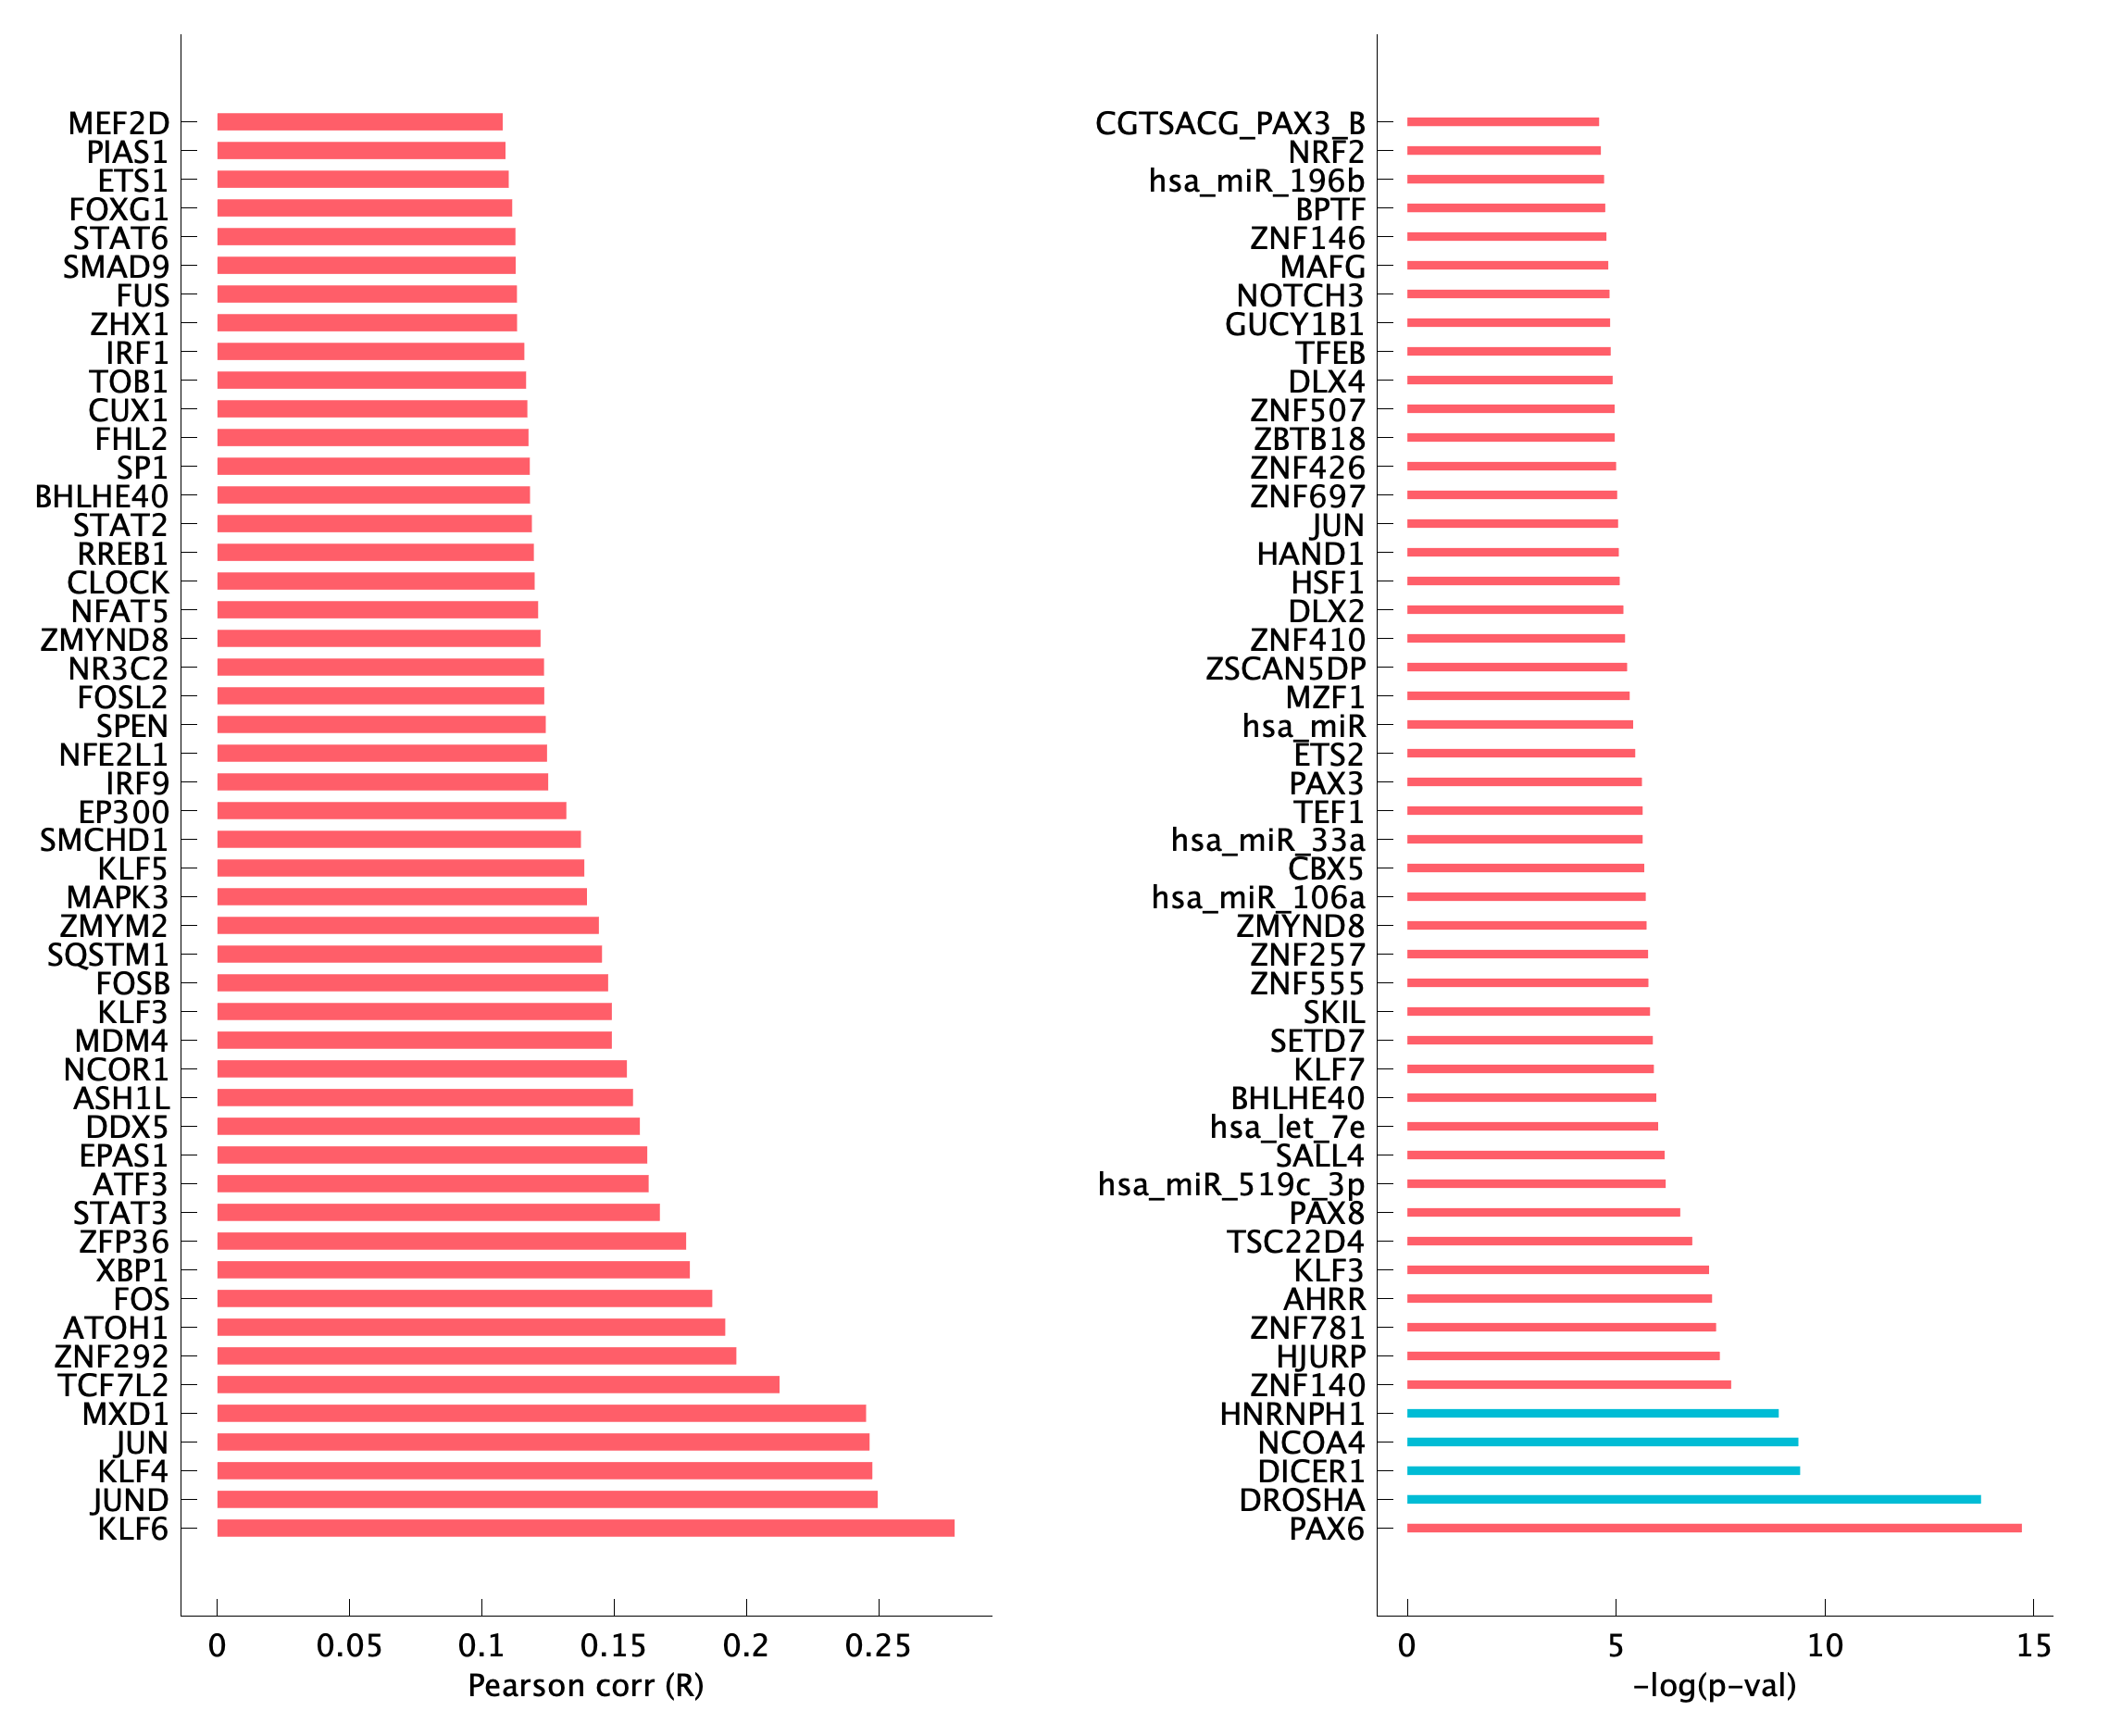
MIRNA
|
MIRNA:hsa-miR-296-3p
|
hsa-miR-296-3p
|
0.0450667793896836
|
255
|
13
|
4
|
0.307692307692308
|
0.0156862745098039
|
|
REAC
|
REAC:R-HSA-163200
|
Respiratory electron transport, ATP synthesis by chemiosmotic coupling, and heat production by uncoupling proteins.
|
0.00336204329712242
|
124
|
13
|
4
|
0.307692307692308
|
0.032258064516129
|
|
REAC
|
REAC:R-HSA-1428517
|
The citric acid (TCA) cycle and respiratory electron transport
|
0.00638665034962316
|
174
|
13
|
4
|
0.307692307692308
|
0.0229885057471264
|
|
REAC
|
REAC:R-HSA-611105
|
Respiratory electron transport
|
0.0185180057003933
|
100
|
13
|
3
|
0.230769230769231
|
0.03
|
|
WP
|
WP:WP111
|
Electron Transport Chain (OXPHOS system in mitochondria)
|
0.000857709184487199
|
105
|
13
|
4
|
0.307692307692308
|
0.0380952380952381
|
|
WP
|
WP:WP623
|
Oxidative phosphorylation
|
0.000857709184487199
|
62
|
7
|
3
|
0.428571428571429
|
0.0483870967741935
|