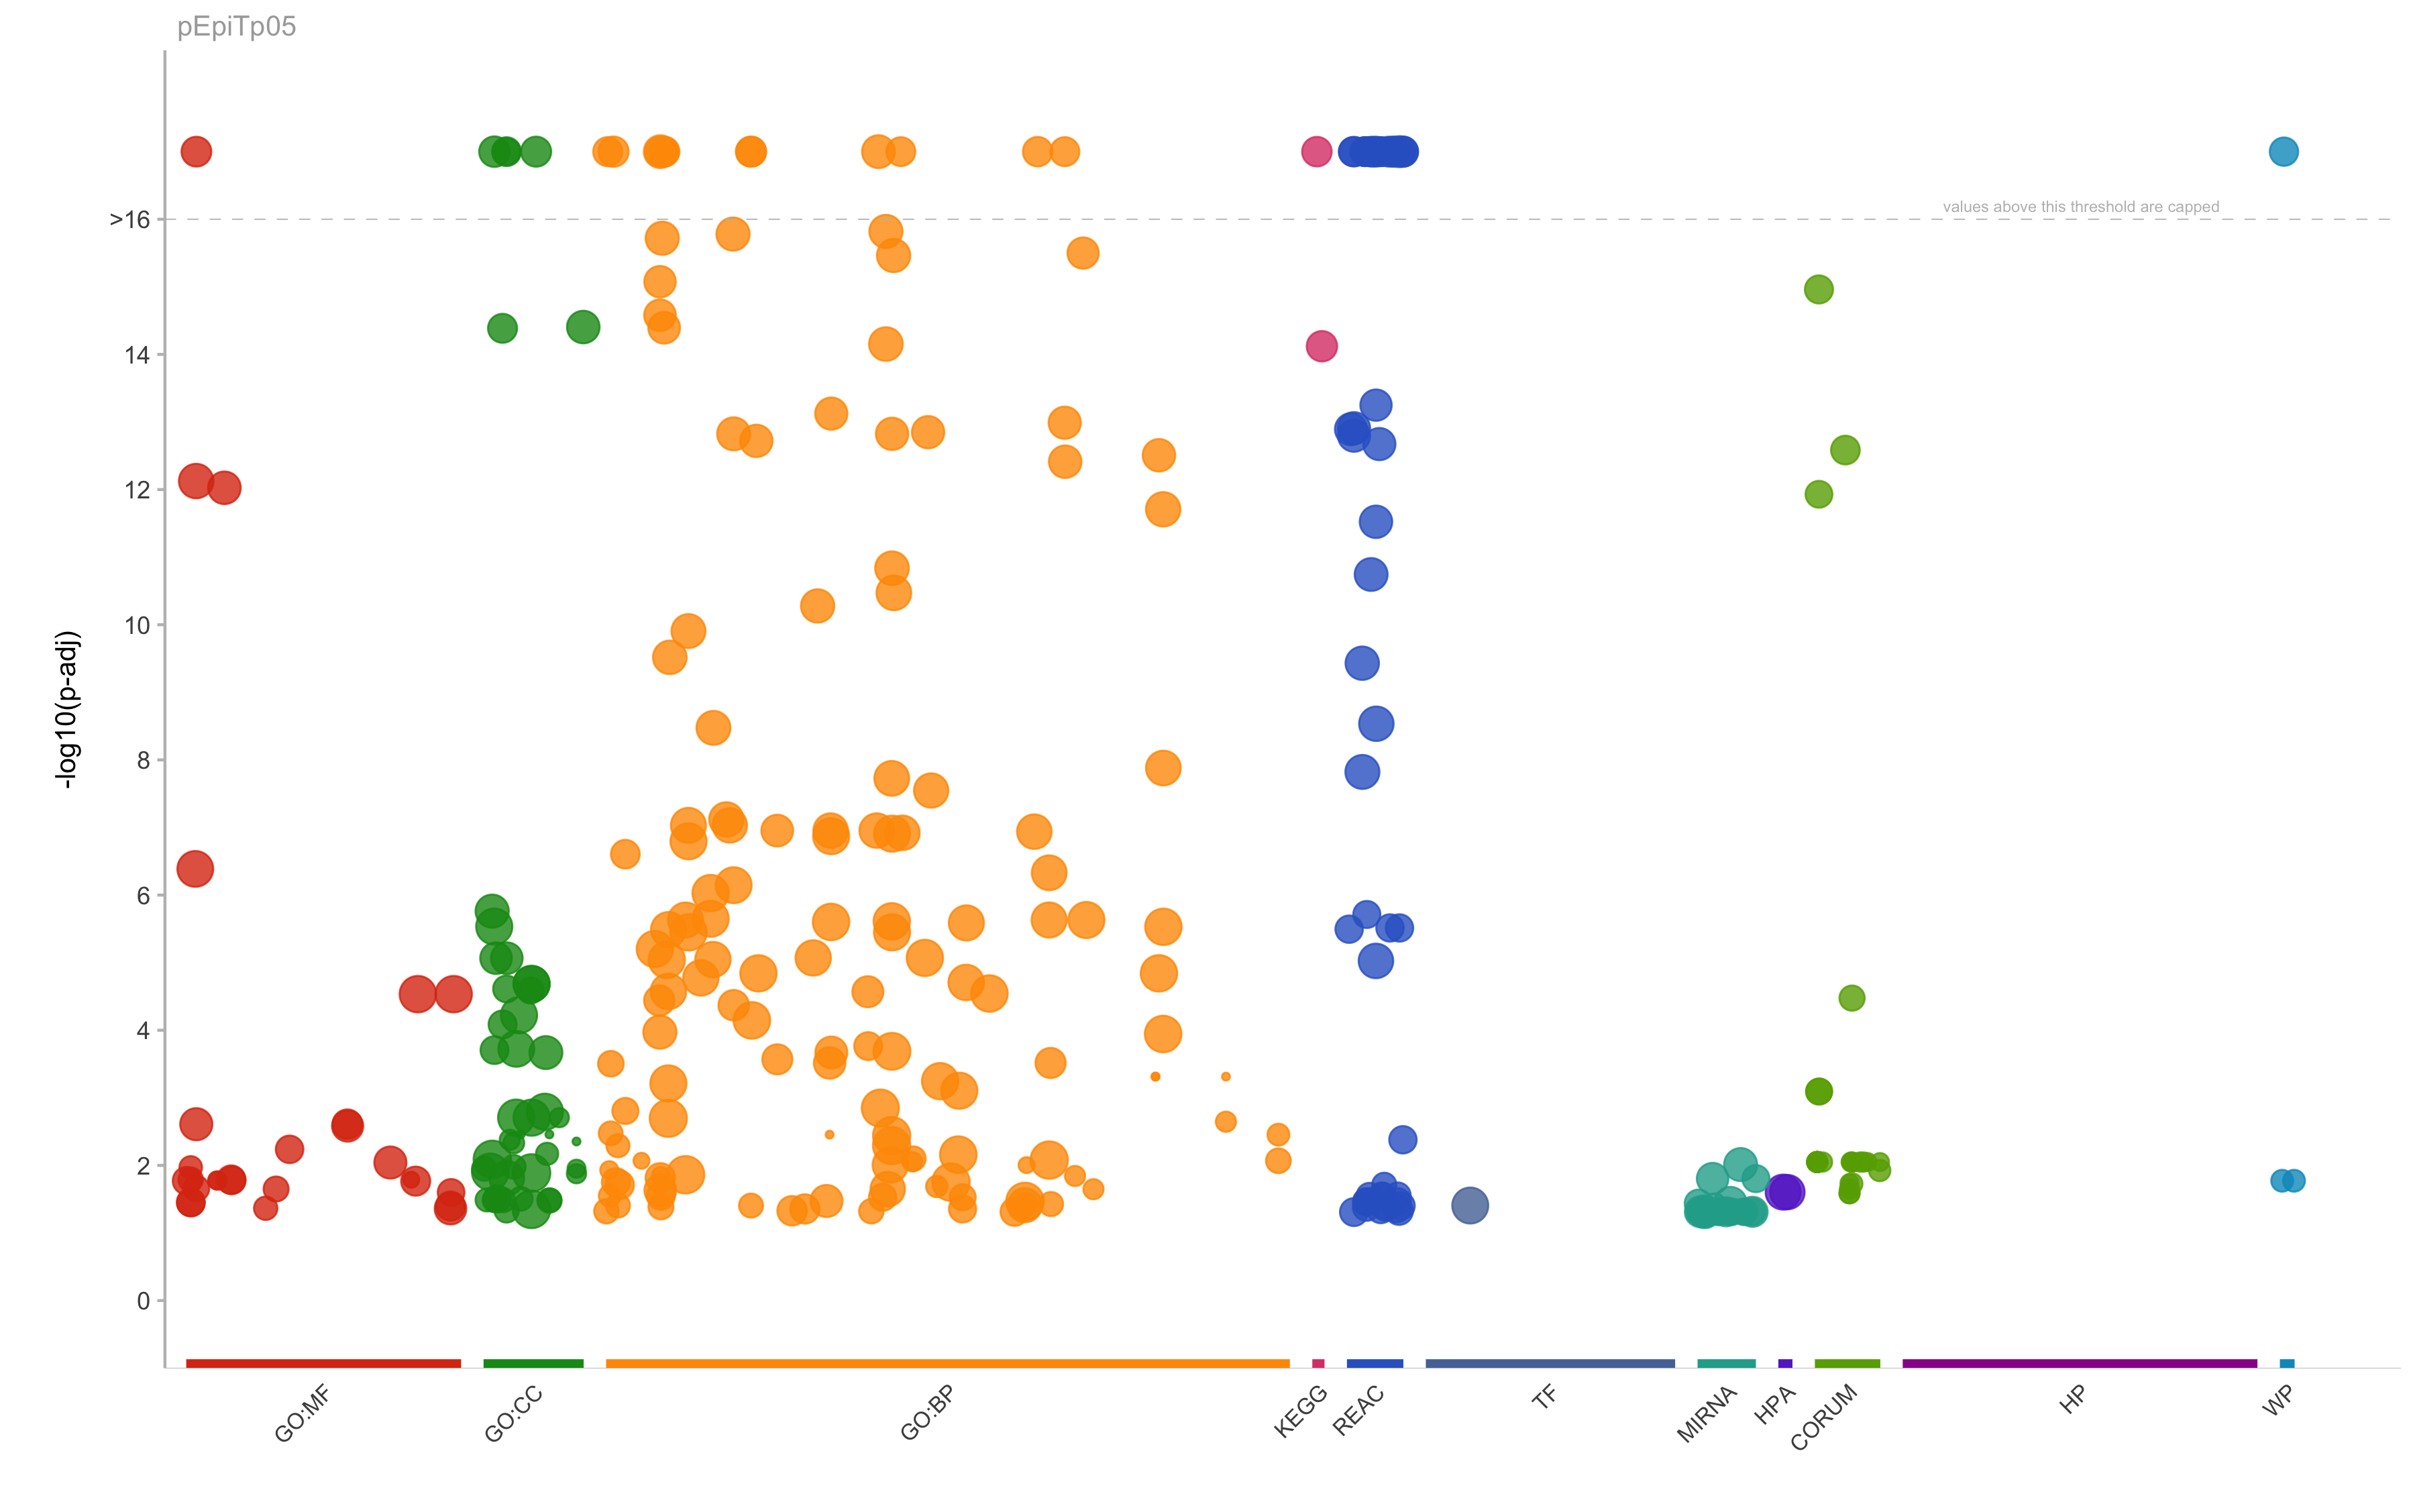
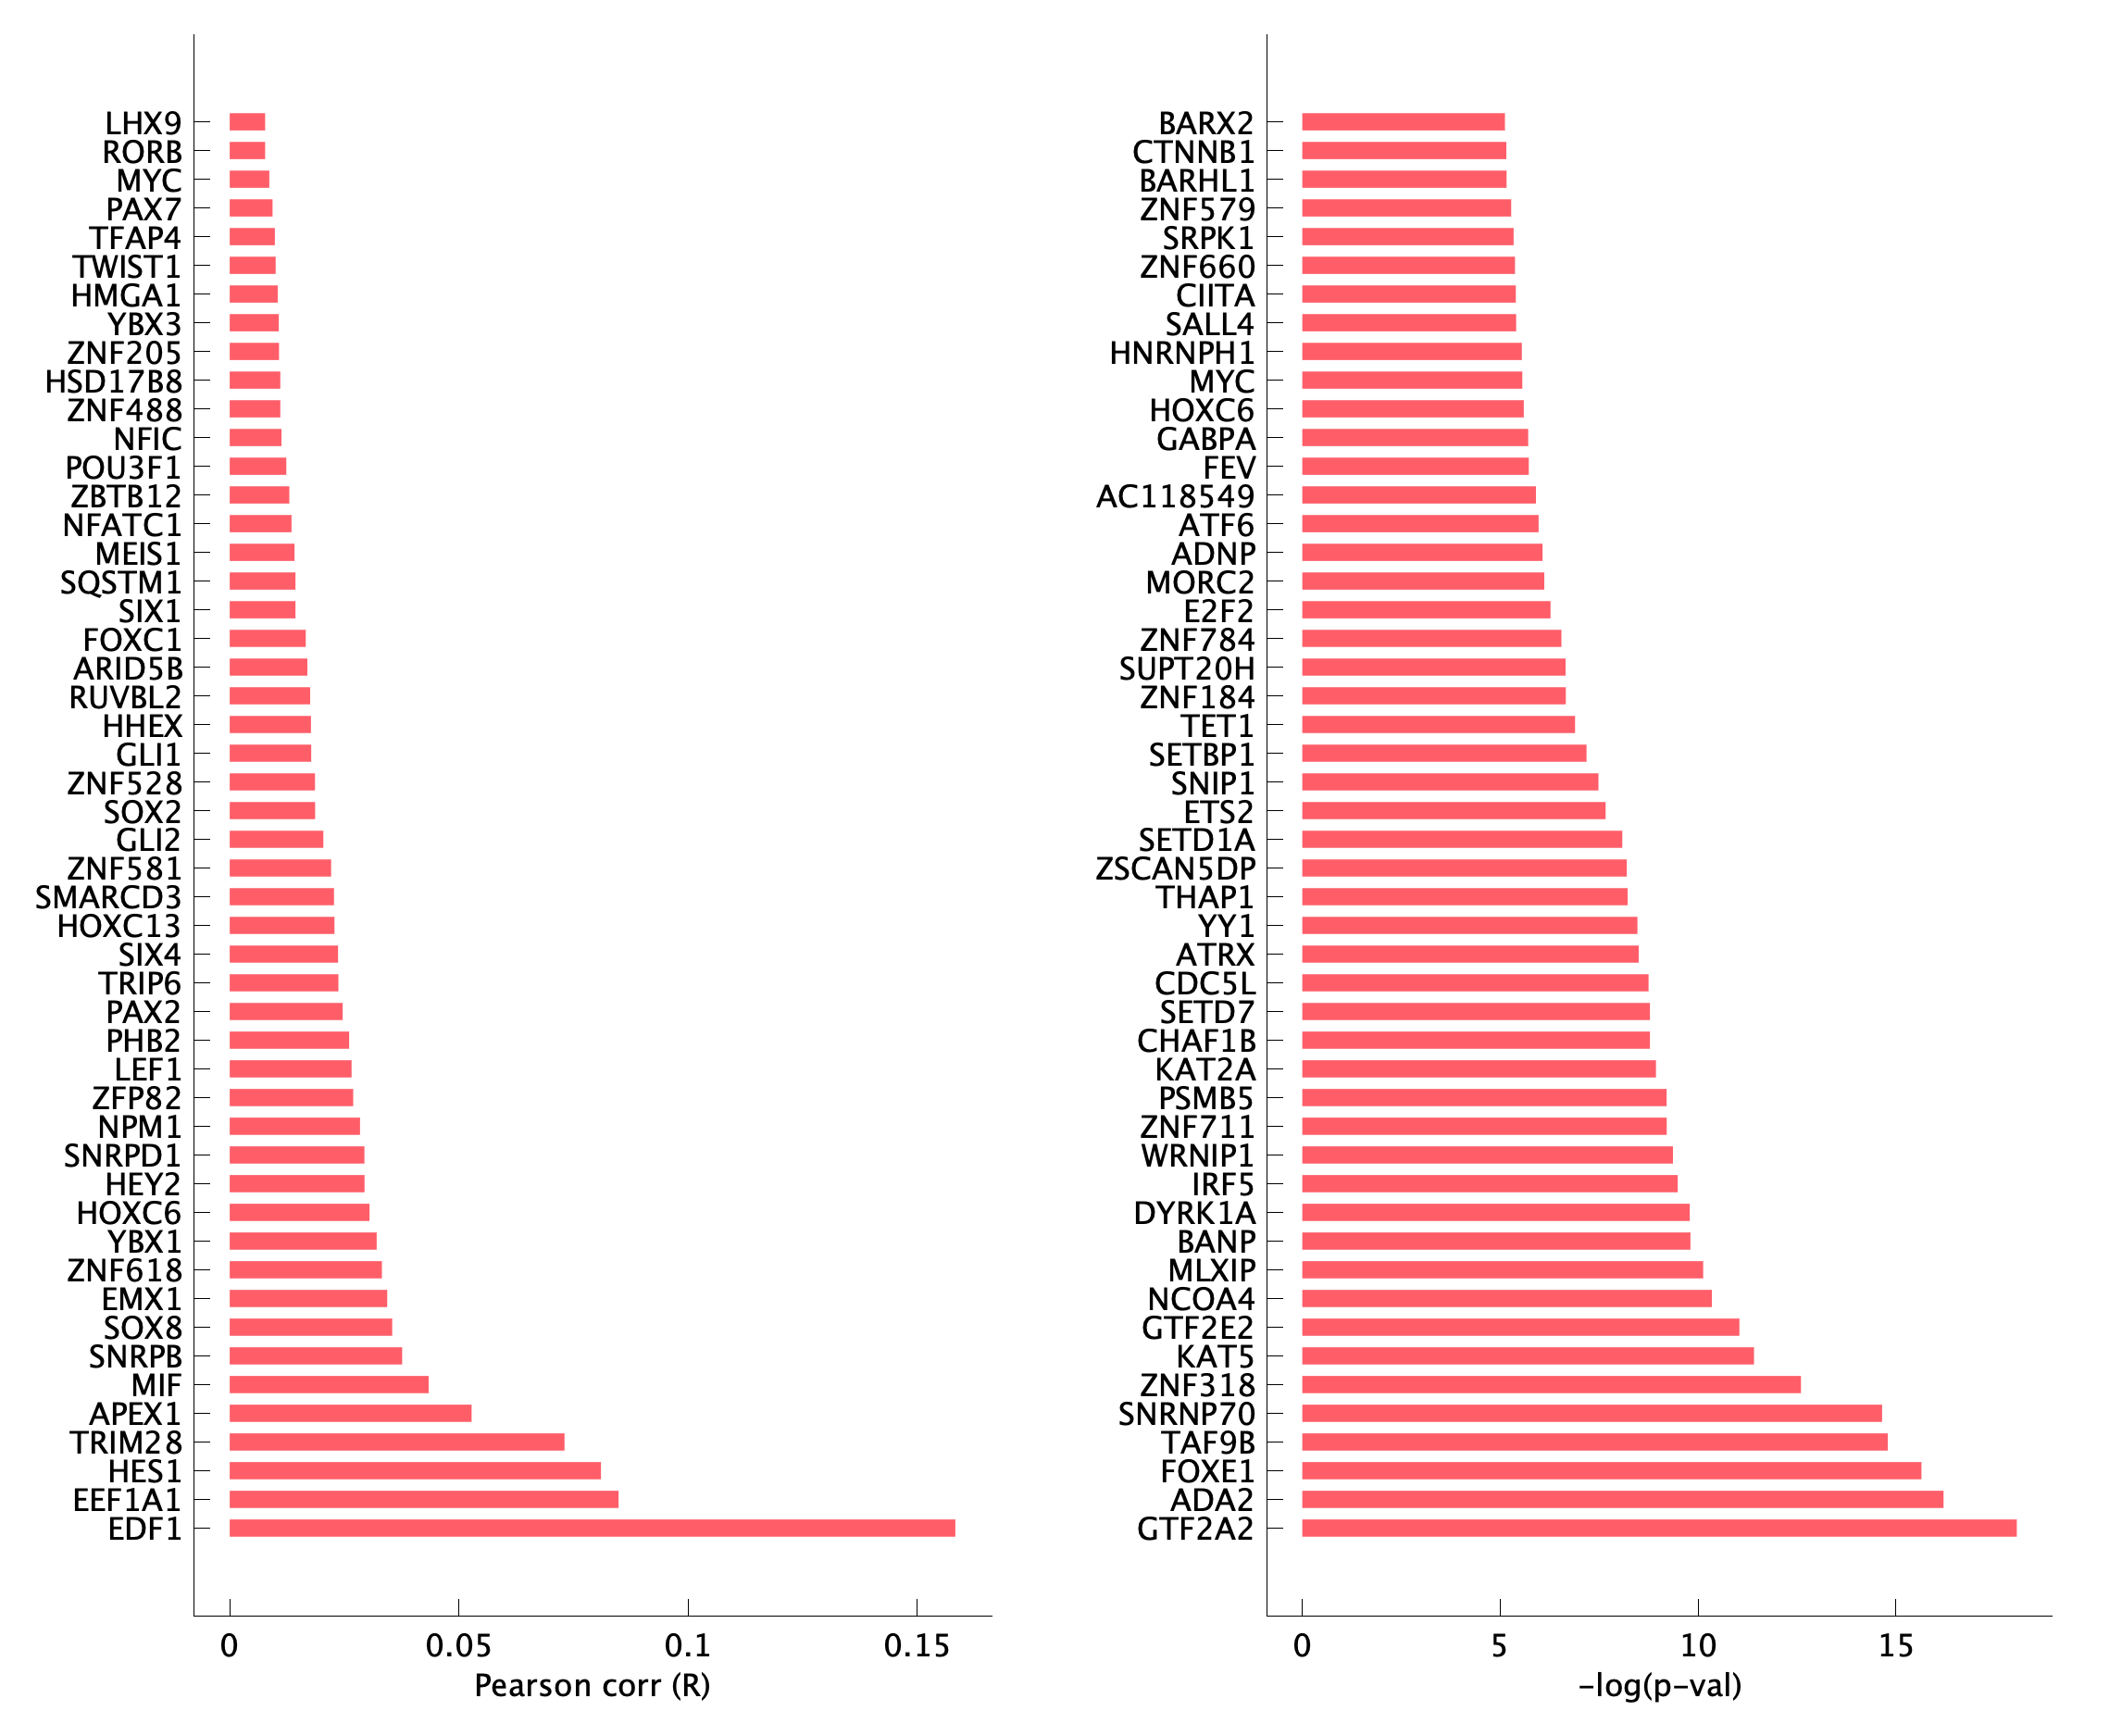
|
CORUM
|
CORUM:306
|
Ribosome, cytoplasmic
|
1.09292984524712e-15
|
80
|
17
|
12
|
0.705882352941177
|
0.15
|
|
CORUM
|
CORUM:3055
|
Nop56p-associated pre-rRNA complex
|
2.60352815116075e-13
|
104
|
12
|
10
|
0.833333333333333
|
0.0961538461538462
|
|
CORUM
|
CORUM:308
|
60S ribosomal subunit, cytoplasmic
|
1.17397647145602e-12
|
47
|
17
|
9
|
0.529411764705882
|
0.191489361702128
|
|
CORUM
|
CORUM:5380
|
TRBP containing complex (DICER, RPL7A, EIF6, MOV10 and subunits of the 60S ribosomal particle)
|
3.34641516586003e-05
|
25
|
17
|
4
|
0.235294117647059
|
0.16
|
|
CORUM
|
CORUM:338
|
40S ribosomal subunit, cytoplasmic
|
0.000803210421271609
|
31
|
12
|
3
|
0.25
|
0.0967741935483871
|
|
CORUM
|
CORUM:305
|
40S ribosomal subunit, cytoplasmic
|
0.000809410877169821
|
33
|
12
|
3
|
0.25
|
0.0909090909090909
|
|
GO:BP
|
GO:0006614
|
SRP-dependent cotranslational protein targeting to membrane
|
5.94959093169247e-22
|
96
|
17
|
12
|
0.705882352941177
|
0.125
|
|
GO:BP
|
GO:0006613
|
cotranslational protein targeting to membrane
|
6.42380894147039e-22
|
102
|
17
|
12
|
0.705882352941177
|
0.117647058823529
|
|
GO:BP
|
GO:0045047
|
protein targeting to ER
|
1.56206908416883e-21
|
113
|
17
|
12
|
0.705882352941177
|
0.106194690265487
|
|
GO:BP
|
GO:0072599
|
establishment of protein localization to endoplasmic reticulum
|
1.81510951728114e-21
|
117
|
17
|
12
|
0.705882352941177
|
0.102564102564103
|
|
GO:BP
|
GO:0000184
|
nuclear-transcribed mRNA catabolic process, nonsense-mediated decay
|
2.72100825417603e-21
|
123
|
17
|
12
|
0.705882352941177
|
0.0975609756097561
|
|
GO:BP
|
GO:0006413
|
translational initiation
|
3.48761556600287e-21
|
201
|
17
|
13
|
0.764705882352941
|
0.0646766169154229
|
|
GO:BP
|
GO:0019080
|
viral gene expression
|
3.48761556600287e-21
|
199
|
17
|
13
|
0.764705882352941
|
0.0653266331658292
|
|
GO:BP
|
GO:0070972
|
protein localization to endoplasmic reticulum
|
1.44672537789911e-20
|
146
|
17
|
12
|
0.705882352941177
|
0.0821917808219178
|
|
GO:BP
|
GO:0019083
|
viral transcription
|
1.84121177903161e-19
|
181
|
17
|
12
|
0.705882352941177
|
0.0662983425414365
|
|
GO:BP
|
GO:0006612
|
protein targeting to membrane
|
7.22432803464572e-19
|
204
|
17
|
12
|
0.705882352941177
|
0.0588235294117647
|
|
GO:BP
|
GO:0000956
|
nuclear-transcribed mRNA catabolic process
|
1.18169930181459e-18
|
214
|
17
|
12
|
0.705882352941177
|
0.0560747663551402
|
|
GO:BP
|
GO:0006412
|
translation
|
8.89763056471998e-18
|
764
|
17
|
15
|
0.882352941176471
|
0.0196335078534031
|
|
GO:BP
|
GO:0043043
|
peptide biosynthetic process
|
1.35922064822461e-17
|
790
|
17
|
15
|
0.882352941176471
|
0.0189873417721519
|
|
GO:BP
|
GO:0043604
|
amide biosynthetic process
|
1.51409649816161e-16
|
932
|
17
|
15
|
0.882352941176471
|
0.0160944206008584
|
|
GO:BP
|
GO:0016032
|
viral process
|
1.6586994558786e-16
|
942
|
17
|
15
|
0.882352941176471
|
0.0159235668789809
|
|
GO:BP
|
GO:0006518
|
peptide metabolic process
|
1.91019357548382e-16
|
955
|
17
|
15
|
0.882352941176471
|
0.0157068062827225
|
|
GO:BP
|
GO:0090150
|
establishment of protein localization to membrane
|
3.16688945895632e-16
|
351
|
17
|
12
|
0.705882352941177
|
0.0341880341880342
|
|
GO:BP
|
GO:0044403
|
biological process involved in symbiotic interaction
|
3.43893687856545e-16
|
1001
|
17
|
15
|
0.882352941176471
|
0.014985014985015
|
|
GO:BP
|
GO:0006402
|
mRNA catabolic process
|
8.39587480298114e-16
|
384
|
17
|
12
|
0.705882352941177
|
0.03125
|
|
GO:BP
|
GO:0006401
|
RNA catabolic process
|
2.63552386398186e-15
|
424
|
17
|
12
|
0.705882352941177
|
0.0283018867924528
|
|
GO:BP
|
GO:0006605
|
protein targeting
|
4.02977766868787e-15
|
441
|
17
|
12
|
0.705882352941177
|
0.0272108843537415
|
|
GO:BP
|
GO:0043603
|
cellular amide metabolic process
|
7.0271225419373e-15
|
1241
|
17
|
15
|
0.882352941176471
|
0.0120870265914585
|
|
GO:BP
|
GO:0034655
|
nucleobase-containing compound catabolic process
|
7.51408125572057e-14
|
567
|
17
|
12
|
0.705882352941177
|
0.0211640211640212
|
|
GO:BP
|
GO:0072594
|
establishment of protein localization to organelle
|
1.02542725252217e-13
|
584
|
17
|
12
|
0.705882352941177
|
0.0205479452054795
|
|
GO:BP
|
GO:0046700
|
heterocycle catabolic process
|
1.41518855371259e-13
|
602
|
17
|
12
|
0.705882352941177
|
0.0199335548172757
|
|
GO:BP
|
GO:0016071
|
mRNA metabolic process
|
1.49725365331486e-13
|
874
|
20
|
14
|
0.7
|
0.0160183066361556
|
|
GO:BP
|
GO:0044270
|
cellular nitrogen compound catabolic process
|
1.49725365331486e-13
|
608
|
17
|
12
|
0.705882352941177
|
0.0197368421052632
|
|
GO:BP
|
GO:0019439
|
aromatic compound catabolic process
|
1.90337135962668e-13
|
623
|
17
|
12
|
0.705882352941177
|
0.0192616372391653
|
|
GO:BP
|
GO:1901361
|
organic cyclic compound catabolic process
|
3.10600536426812e-13
|
651
|
17
|
12
|
0.705882352941177
|
0.0184331797235023
|
|
GO:BP
|
GO:0072657
|
protein localization to membrane
|
3.86993031996029e-13
|
665
|
17
|
12
|
0.705882352941177
|
0.0180451127819549
|
|
GO:BP
|
GO:1901566
|
organonitrogen compound biosynthetic process
|
1.9575509196471e-12
|
1853
|
17
|
15
|
0.882352941176471
|
0.00809498111171074
|
|
GO:BP
|
GO:0044265
|
cellular macromolecule catabolic process
|
1.45756741019269e-11
|
1231
|
17
|
13
|
0.764705882352941
|
0.0105605199025183
|
|
GO:BP
|
GO:0044419
|
biological process involved in interspecies interaction between organisms
|
3.37152266289701e-11
|
2255
|
17
|
15
|
0.882352941176471
|
0.00665188470066519
|
|
GO:BP
|
GO:0033365
|
protein localization to organelle
|
5.26925012059334e-11
|
1017
|
17
|
12
|
0.705882352941177
|
0.0117994100294985
|
|
GO:BP
|
GO:0009057
|
macromolecule catabolic process
|
1.24052020517966e-10
|
1468
|
12
|
11
|
0.916666666666667
|
0.00749318801089918
|
|
GO:BP
|
GO:0006886
|
intracellular protein transport
|
3.03634604686159e-10
|
1186
|
17
|
12
|
0.705882352941177
|
0.0101180438448567
|
|
GO:BP
|
GO:0010629
|
negative regulation of gene expression
|
3.35568130561324e-09
|
1460
|
17
|
12
|
0.705882352941177
|
0.00821917808219178
|
|
GO:BP
|
GO:1901575
|
organic substance catabolic process
|
1.31896161563529e-08
|
2267
|
12
|
11
|
0.916666666666667
|
0.00485222761358624
|
|
GO:BP
|
GO:0044248
|
cellular catabolic process
|
1.87498715826941e-08
|
2347
|
12
|
11
|
0.916666666666667
|
0.00468683425649766
|
|
GO:BP
|
GO:0046907
|
intracellular transport
|
2.83808587662588e-08
|
1767
|
17
|
12
|
0.705882352941177
|
0.0067911714770798
|
|
GO:BP
|
GO:0015031
|
protein transport
|
7.60470907367263e-08
|
1929
|
17
|
12
|
0.705882352941177
|
0.00622083981337481
|
|
GO:BP
|
GO:0015833
|
peptide transport
|
9.30331656346135e-08
|
1971
|
17
|
12
|
0.705882352941177
|
0.0060882800608828
|
|
GO:BP
|
GO:0009056
|
catabolic process
|
9.30331656346135e-08
|
2744
|
12
|
11
|
0.916666666666667
|
0.00400874635568513
|
|
GO:BP
|
GO:0042886
|
amide transport
|
1.11183465306464e-07
|
2007
|
17
|
12
|
0.705882352941177
|
0.00597907324364723
|
|
GO:BP
|
GO:0034613
|
cellular protein localization
|
1.11183465306464e-07
|
2014
|
17
|
12
|
0.705882352941177
|
0.00595829195630586
|
|
GO:BP
|
GO:0022613
|
ribonucleoprotein complex biogenesis
|
1.11183465306464e-07
|
446
|
20
|
8
|
0.4
|
0.0179372197309417
|
|
GO:BP
|
GO:0070727
|
cellular macromolecule localization
|
1.15173779360081e-07
|
2024
|
17
|
12
|
0.705882352941177
|
0.00592885375494071
|
|
GO:BP
|
GO:0045184
|
establishment of protein localization
|
1.19999807605803e-07
|
2035
|
17
|
12
|
0.705882352941177
|
0.0058968058968059
|
|
GO:BP
|
GO:0044271
|
cellular nitrogen compound biosynthetic process
|
1.23422295842169e-07
|
5017
|
17
|
16
|
0.941176470588235
|
0.00318915686665338
|
|
GO:BP
|
GO:0034645
|
cellular macromolecule biosynthetic process
|
1.34456942085055e-07
|
5051
|
17
|
16
|
0.941176470588235
|
0.00316768956642249
|
|
GO:BP
|
GO:0009059
|
macromolecule biosynthetic process
|
1.60070998470966e-07
|
5114
|
17
|
16
|
0.941176470588235
|
0.00312866640594447
|
|
GO:BP
|
GO:0002181
|
cytoplasmic translation
|
2.4827410741305e-07
|
103
|
17
|
5
|
0.294117647058824
|
0.0485436893203883
|
|
GO:BP
|
GO:0071705
|
nitrogen compound transport
|
4.68046838785018e-07
|
2322
|
12
|
10
|
0.833333333333333
|
0.00430663221360896
|
|
GO:BP
|
GO:0016070
|
RNA metabolic process
|
7.14556989677001e-07
|
4710
|
12
|
12
|
1
|
0.00254777070063694
|
|
GO:BP
|
GO:0010467
|
gene expression
|
9.34159674043352e-07
|
6179
|
21
|
19
|
0.904761904761905
|
0.00307493121864379
|
|
GO:BP
|
GO:0010468
|
regulation of gene expression
|
2.24177243710276e-06
|
5196
|
12
|
12
|
1
|
0.0023094688221709
|
|
GO:BP
|
GO:0008104
|
protein localization
|
2.33827460742604e-06
|
2770
|
12
|
10
|
0.833333333333333
|
0.0036101083032491
|
|
GO:BP
|
GO:0071702
|
organic substance transport
|
2.33827460742604e-06
|
2766
|
12
|
10
|
0.833333333333333
|
0.00361532899493854
|
|
GO:BP
|
GO:0090304
|
nucleic acid metabolic process
|
2.33827460742604e-06
|
5226
|
12
|
12
|
1
|
0.00229621125143513
|
|
GO:BP
|
GO:0044249
|
cellular biosynthetic process
|
2.44688334220266e-06
|
6154
|
17
|
16
|
0.941176470588235
|
0.00259993500162496
|
|
GO:BP
|
GO:0034641
|
cellular nitrogen compound metabolic process
|
2.49711799313622e-06
|
6563
|
21
|
19
|
0.904761904761905
|
0.00289501752247448
|
|
GO:BP
|
GO:0051649
|
establishment of localization in cell
|
2.58337448938177e-06
|
2813
|
12
|
10
|
0.833333333333333
|
0.00355492356914326
|
|
GO:BP
|
GO:1901576
|
organic substance biosynthetic process
|
2.9495729345284e-06
|
6248
|
17
|
16
|
0.941176470588235
|
0.00256081946222791
|
|
GO:BP
|
GO:0006820
|
anion transport
|
3.23967035271654e-06
|
2889
|
12
|
10
|
0.833333333333333
|
0.00346140533056421
|
|
GO:BP
|
GO:0044267
|
cellular protein metabolic process
|
3.55897236740962e-06
|
5229
|
17
|
15
|
0.882352941176471
|
0.00286861732644865
|
|
GO:BP
|
GO:0009058
|
biosynthetic process
|
3.55897236740962e-06
|
6340
|
17
|
16
|
0.941176470588235
|
0.00252365930599369
|
|
GO:BP
|
GO:0006139
|
nucleobase-containing compound metabolic process
|
6.27467549590134e-06
|
5746
|
12
|
12
|
1
|
0.00208840932822833
|
|
GO:BP
|
GO:0033036
|
macromolecule localization
|
8.51145282495369e-06
|
3218
|
12
|
10
|
0.833333333333333
|
0.00310752019888129
|
|
GO:BP
|
GO:0046483
|
heterocycle metabolic process
|
8.51145282495369e-06
|
5904
|
12
|
12
|
1
|
0.00203252032520325
|
|
GO:BP
|
GO:0010605
|
negative regulation of macromolecule metabolic process
|
8.98532335813799e-06
|
3241
|
12
|
10
|
0.833333333333333
|
0.00308546744831842
|
|
GO:BP
|
GO:0006725
|
cellular aromatic compound metabolic process
|
9.11281699659351e-06
|
5956
|
12
|
12
|
1
|
0.00201477501678979
|
|
GO:BP
|
GO:1901360
|
organic cyclic compound metabolic process
|
1.4383448638126e-05
|
6201
|
12
|
12
|
1
|
0.0019351717464925
|
|
GO:BP
|
GO:0019538
|
protein metabolic process
|
1.4383448638126e-05
|
5808
|
17
|
15
|
0.882352941176471
|
0.00258264462809917
|
|
GO:BP
|
GO:0009892
|
negative regulation of metabolic process
|
1.67924653078944e-05
|
3479
|
12
|
10
|
0.833333333333333
|
0.00287438919229664
|
|
GO:BP
|
GO:0051641
|
cellular localization
|
1.96257041953075e-05
|
3541
|
12
|
10
|
0.833333333333333
|
0.00282406099971759
|
|
GO:BP
|
GO:0006811
|
ion transport
|
2.66453946183159e-05
|
3661
|
12
|
10
|
0.833333333333333
|
0.00273149412728763
|
|
GO:BP
|
GO:0042254
|
ribosome biogenesis
|
2.69199902443435e-05
|
307
|
16
|
5
|
0.3125
|
0.0162866449511401
|
|
GO:BP
|
GO:0060255
|
regulation of macromolecule metabolic process
|
2.86238357277617e-05
|
6603
|
12
|
12
|
1
|
0.00181735574738755
|
|
GO:BP
|
GO:0006364
|
rRNA processing
|
3.63124503304795e-05
|
224
|
11
|
4
|
0.363636363636364
|
0.0178571428571429
|
|
GO:BP
|
GO:0016072
|
rRNA metabolic process
|
4.26199912435125e-05
|
234
|
11
|
4
|
0.363636363636364
|
0.0170940170940171
|
|
GO:BP
|
GO:0019222
|
regulation of metabolic process
|
7.14476125574459e-05
|
7148
|
12
|
12
|
1
|
0.00167879127028539
|
|
GO:BP
|
GO:0006396
|
RNA processing
|
0.000106651356495873
|
964
|
24
|
8
|
0.333333333333333
|
0.00829875518672199
|
|
GO:BP
|
GO:1901564
|
organonitrogen compound metabolic process
|
0.000113672754660547
|
6792
|
17
|
15
|
0.882352941176471
|
0.00220848056537102
|
|
GO:BP
|
GO:0042273
|
ribosomal large subunit biogenesis
|
0.000171682451702708
|
74
|
16
|
3
|
0.1875
|
0.0405405405405405
|
|
GO:BP
|
GO:0044260
|
cellular macromolecule metabolic process
|
0.000205095884586793
|
8390
|
17
|
16
|
0.941176470588235
|
0.00190703218116806
|
|
GO:BP
|
GO:0034660
|
ncRNA metabolic process
|
0.000213546071188052
|
493
|
25
|
6
|
0.24
|
0.0121703853955375
|
|
GO:BP
|
GO:0022618
|
ribonucleoprotein complex assembly
|
0.00026946980592802
|
197
|
20
|
4
|
0.2
|
0.0203045685279188
|
|
GO:BP
|
GO:0071826
|
ribonucleoprotein complex subunit organization
|
0.000304863285436676
|
204
|
20
|
4
|
0.2
|
0.0196078431372549
|
|
GO:BP
|
GO:0034470
|
ncRNA processing
|
0.000304863285436676
|
397
|
11
|
4
|
0.363636363636364
|
0.0100755667506297
|
|
GO:BP
|
GO:0048519
|
negative regulation of biological process
|
0.000566206385043709
|
5757
|
13
|
11
|
0.846153846153846
|
0.00191071738752823
|
|
GO:BP
|
GO:0006810
|
transport
|
0.000612167538008189
|
5224
|
12
|
10
|
0.833333333333333
|
0.00191424196018377
|
|
GO:BP
|
GO:0051234
|
establishment of localization
|
0.000785240808028456
|
5372
|
12
|
10
|
0.833333333333333
|
0.00186150409530901
|
|
GO:BP
|
GO:0043170
|
macromolecule metabolic process
|
0.00141864809063063
|
9796
|
13
|
13
|
1
|
0.00132707227439771
|
|
GO:BP
|
GO:0006807
|
nitrogen compound metabolic process
|
0.0020106689399758
|
10078
|
13
|
13
|
1
|
0.00128993847985711
|
|
GO:BP
|
GO:0044238
|
primary metabolic process
|
0.003619798980852
|
10584
|
13
|
13
|
1
|
0.00122826908541194
|
|
GO:BP
|
GO:0044237
|
cellular metabolic process
|
0.00507771937758558
|
10871
|
13
|
13
|
1
|
0.00119584214883635
|
|
GO:BP
|
GO:0051179
|
localization
|
0.00692751678439003
|
6901
|
12
|
10
|
0.833333333333333
|
0.00144906535284741
|
|
GO:BP
|
GO:0071704
|
organic substance metabolic process
|
0.00833774433103947
|
11326
|
13
|
13
|
1
|
0.0011478015186297
|
|
GO:BP
|
GO:0044085
|
cellular component biogenesis
|
0.00986072125796252
|
3257
|
22
|
10
|
0.454545454545455
|
0.00307031010132023
|
|
GO:BP
|
GO:0008152
|
metabolic process
|
0.0137568304372121
|
11827
|
13
|
13
|
1
|
0.00109917984273273
|
|
GO:BP
|
GO:0050789
|
regulation of biological process
|
0.0176979765558177
|
12091
|
13
|
13
|
1
|
0.00107517988586552
|
|
GO:BP
|
GO:0043933
|
protein-containing complex subunit organization
|
0.0224596556311215
|
1963
|
22
|
7
|
0.318181818181818
|
0.00356597045338767
|
|
GO:BP
|
GO:0006417
|
regulation of translation
|
0.0233860891421502
|
462
|
16
|
3
|
0.1875
|
0.00649350649350649
|
|
GO:BP
|
GO:0034248
|
regulation of cellular amide metabolic process
|
0.0336091401306869
|
535
|
16
|
3
|
0.1875
|
0.00560747663551402
|
|
GO:BP
|
GO:0065007
|
biological regulation
|
0.034115390762436
|
12809
|
13
|
13
|
1
|
0.0010149113904286
|
|
GO:BP
|
GO:0065003
|
protein-containing complex assembly
|
0.0388072258999021
|
1680
|
22
|
6
|
0.272727272727273
|
0.00357142857142857
|
|
GO:CC
|
GO:0022626
|
cytosolic ribosome
|
4.34446391066148e-22
|
109
|
17
|
12
|
0.705882352941177
|
0.110091743119266
|
|
GO:CC
|
GO:0005840
|
ribosome
|
2.38171017106273e-20
|
245
|
17
|
13
|
0.764705882352941
|
0.0530612244897959
|
|
GO:CC
|
GO:0044391
|
ribosomal subunit
|
1.46842030744881e-19
|
190
|
17
|
12
|
0.705882352941177
|
0.0631578947368421
|
|
GO:CC
|
GO:0022625
|
cytosolic large ribosomal subunit
|
6.34960908886088e-18
|
57
|
17
|
9
|
0.529411764705882
|
0.157894736842105
|
|
GO:CC
|
GO:1990904
|
ribonucleoprotein complex
|
3.93595166246228e-15
|
688
|
20
|
14
|
0.7
|
0.0203488372093023
|
|
GO:CC
|
GO:0015934
|
large ribosomal subunit
|
4.11017114624722e-15
|
118
|
17
|
9
|
0.529411764705882
|
0.076271186440678
|
|
GO:CC
|
GO:0005730
|
nucleolus
|
1.72968723095685e-06
|
955
|
19
|
9
|
0.473684210526316
|
0.00942408376963351
|
|
GO:CC
|
GO:0005829
|
cytosol
|
2.92448777410421e-06
|
5303
|
12
|
12
|
1
|
0.00226287007354328
|
|
GO:CC
|
GO:0005925
|
focal adhesion
|
8.58176792886324e-06
|
420
|
16
|
6
|
0.375
|
0.0142857142857143
|
|
GO:CC
|
GO:0030055
|
cell-substrate junction
|
8.58176792886324e-06
|
427
|
16
|
6
|
0.375
|
0.0140515222482436
|
|
GO:CC
|
GO:0043232
|
intracellular non-membrane-bounded organelle
|
2.06705210824037e-05
|
5338
|
13
|
12
|
0.923076923076923
|
0.00224803297115024
|
|
GO:CC
|
GO:0043228
|
non-membrane-bounded organelle
|
2.06705210824037e-05
|
5346
|
13
|
12
|
0.923076923076923
|
0.00224466891133558
|
|
GO:CC
|
GO:0022627
|
cytosolic small ribosomal subunit
|
2.44979907054871e-05
|
47
|
12
|
3
|
0.25
|
0.0638297872340425
|
|
GO:CC
|
GO:0042788
|
polysomal ribosome
|
2.59092587249354e-05
|
34
|
17
|
3
|
0.176470588235294
|
0.0882352941176471
|
|
GO:CC
|
GO:0032991
|
protein-containing complex
|
6.00442707111928e-05
|
5548
|
17
|
14
|
0.823529411764706
|
0.00252343186733958
|
|
GO:CC
|
GO:0015935
|
small ribosomal subunit
|
8.20665629590041e-05
|
75
|
12
|
3
|
0.25
|
0.04
|
|
GO:CC
|
GO:0031981
|
nuclear lumen
|
0.000188332281261074
|
4444
|
21
|
14
|
0.666666666666667
|
0.00315031503150315
|
|
GO:CC
|
GO:0005844
|
polysome
|
0.000196657669527285
|
72
|
17
|
3
|
0.176470588235294
|
0.0416666666666667
|
|
GO:CC
|
GO:0070161
|
anchoring junction
|
0.000214189335057097
|
836
|
16
|
6
|
0.375
|
0.00717703349282297
|
|
GO:CC
|
GO:0070013
|
intracellular organelle lumen
|
0.00160639193633589
|
5402
|
21
|
14
|
0.666666666666667
|
0.00259163272861903
|
|
GO:CC
|
GO:0043233
|
organelle lumen
|
0.00196423128158275
|
5565
|
21
|
14
|
0.666666666666667
|
0.00251572327044025
|
|
GO:CC
|
GO:0031974
|
membrane-enclosed lumen
|
0.00196423128158275
|
5565
|
21
|
14
|
0.666666666666667
|
0.00251572327044025
|
|
GO:CC
|
GO:0005737
|
cytoplasm
|
0.00812992625150149
|
11911
|
13
|
13
|
1
|
0.00109142809167996
|
|
GO:CC
|
GO:0005634
|
nucleus
|
0.0124724237088462
|
7592
|
6
|
6
|
1
|
0.000790305584826133
|
|
GO:CC
|
GO:0043229
|
intracellular organelle
|
0.0129332821452678
|
12491
|
13
|
13
|
1
|
0.00104074933952446
|
|
GO:CC
|
GO:0030054
|
cell junction
|
0.0154656817951448
|
2105
|
16
|
6
|
0.375
|
0.00285035629453682
|
|
GO:CC
|
GO:0043226
|
organelle
|
0.0446667321882111
|
14008
|
13
|
13
|
1
|
0.000928041119360366
|
|
GO:MF
|
GO:0003735
|
structural constituent of ribosome
|
1.11703639964786e-19
|
171
|
17
|
12
|
0.705882352941177
|
0.0701754385964912
|
|
GO:MF
|
GO:0003723
|
RNA binding
|
7.48155435919412e-13
|
1943
|
25
|
19
|
0.76
|
0.00977869274318065
|
|
GO:MF
|
GO:0005198
|
structural molecule activity
|
9.41222783826468e-13
|
698
|
17
|
12
|
0.705882352941177
|
0.0171919770773639
|
|
GO:MF
|
GO:0003676
|
nucleic acid binding
|
4.10111278714591e-07
|
4276
|
12
|
12
|
1
|
0.00280636108512629
|
|
GO:MF
|
GO:1901363
|
heterocyclic compound binding
|
2.92447388115243e-05
|
6228
|
12
|
12
|
1
|
0.00192678227360308
|
|
GO:MF
|
GO:0097159
|
organic cyclic compound binding
|
2.92447388115243e-05
|
6309
|
12
|
12
|
1
|
0.0019020446980504
|
|
GO:MF
|
GO:0003729
|
mRNA binding
|
0.00245651063511532
|
552
|
5
|
3
|
0.6
|
0.00543478260869565
|
|
GO:MF
|
GO:0045182
|
translation regulator activity
|
0.00245651063511532
|
155
|
15
|
3
|
0.2
|
0.0193548387096774
|
|
GO:MF
|
GO:0045296
|
cadherin binding
|
0.00261661499193295
|
333
|
8
|
3
|
0.375
|
0.00900900900900901
|
|
GO:MF
|
GO:0050839
|
cell adhesion molecule binding
|
0.00906878570580647
|
546
|
8
|
3
|
0.375
|
0.00549450549450549
|
|
GO:MF
|
GO:0140098
|
catalytic activity, acting on RNA
|
0.0436938689156397
|
395
|
25
|
3
|
0.12
|
0.00759493670886076
|
|
HPA
|
HPA:0150053
|
duodenum; glandular cells[High]
|
0.0248384661891849
|
2767
|
11
|
9
|
0.818181818181818
|
0.00325262016624503
|
|
HPA
|
HPA:0350473
|
pancreas; exocrine glandular cells[High]
|
0.0248384661891849
|
1879
|
11
|
8
|
0.727272727272727
|
0.00425758382118148
|
|
KEGG
|
KEGG:03010
|
Ribosome
|
9.70963283418789e-17
|
153
|
17
|
12
|
0.705882352941177
|
0.0784313725490196
|
|
KEGG
|
KEGG:05171
|
Coronavirus disease - COVID-19
|
7.57293088731807e-15
|
231
|
17
|
12
|
0.705882352941177
|
0.051948051948052
|
|
MIRNA
|
MIRNA:hsa-miR-615-3p
|
hsa-miR-615-3p
|
0.0097215571726888
|
891
|
17
|
7
|
0.411764705882353
|
0.00785634118967452
|
|
MIRNA
|
MIRNA:hsa-miR-331-3p
|
hsa-miR-331-3p
|
0.0156767064909984
|
403
|
11
|
4
|
0.363636363636364
|
0.00992555831265509
|
|
MIRNA
|
MIRNA:hsa-miR-484
|
hsa-miR-484
|
0.0365052033515373
|
890
|
19
|
6
|
0.315789473684211
|
0.00674157303370787
|
|
MIRNA
|
MIRNA:hsa-miR-18a-3p
|
hsa-miR-18a-3p
|
0.0485603204963319
|
348
|
10
|
3
|
0.3
|
0.00862068965517241
|
|
MIRNA
|
MIRNA:hsa-miR-186-5p
|
hsa-miR-186-5p
|
0.0485603204963319
|
749
|
19
|
5
|
0.263157894736842
|
0.00667556742323097
|
|
REAC
|
REAC:R-HSA-72689
|
Formation of a pool of free 40S subunits
|
6.87260141193694e-22
|
102
|
17
|
13
|
0.764705882352941
|
0.127450980392157
|
|
REAC
|
REAC:R-HSA-156827
|
L13a-mediated translational silencing of Ceruloplasmin expression
|
9.3670353267644e-22
|
112
|
17
|
13
|
0.764705882352941
|
0.116071428571429
|
|
REAC
|
REAC:R-HSA-72706
|
GTP hydrolysis and joining of the 60S ribosomal subunit
|
9.3670353267644e-22
|
113
|
17
|
13
|
0.764705882352941
|
0.115044247787611
|
|
REAC
|
REAC:R-HSA-72613
|
Eukaryotic Translation Initiation
|
1.27895986146634e-21
|
120
|
17
|
13
|
0.764705882352941
|
0.108333333333333
|
|
REAC
|
REAC:R-HSA-72737
|
Cap-dependent Translation Initiation
|
1.27895986146634e-21
|
120
|
17
|
13
|
0.764705882352941
|
0.108333333333333
|
|
REAC
|
REAC:R-HSA-192823
|
Viral mRNA Translation
|
6.03878204544961e-21
|
90
|
17
|
12
|
0.705882352941177
|
0.133333333333333
|
|
REAC
|
REAC:R-HSA-156902
|
Peptide chain elongation
|
6.03878204544961e-21
|
90
|
17
|
12
|
0.705882352941177
|
0.133333333333333
|
|
REAC
|
REAC:R-HSA-2408557
|
Selenocysteine synthesis
|
7.35706745606294e-21
|
94
|
17
|
12
|
0.705882352941177
|
0.127659574468085
|
|
REAC
|
REAC:R-HSA-156842
|
Eukaryotic Translation Elongation
|
7.35706745606294e-21
|
94
|
17
|
12
|
0.705882352941177
|
0.127659574468085
|
|
REAC
|
REAC:R-HSA-72764
|
Eukaryotic Translation Termination
|
7.35706745606294e-21
|
94
|
17
|
12
|
0.705882352941177
|
0.127659574468085
|
|
REAC
|
REAC:R-HSA-975956
|
Nonsense Mediated Decay (NMD) independent of the Exon Junction Complex (EJC)
|
8.74109920170692e-21
|
96
|
17
|
12
|
0.705882352941177
|
0.125
|
|
REAC
|
REAC:R-HSA-9633012
|
Response of EIF2AK4 (GCN2) to amino acid deficiency
|
1.72834100021785e-20
|
102
|
17
|
12
|
0.705882352941177
|
0.117647058823529
|
|
REAC
|
REAC:R-HSA-1799339
|
SRP-dependent cotranslational protein targeting to membrane
|
5.50698668624597e-20
|
113
|
17
|
12
|
0.705882352941177
|
0.106194690265487
|
|
REAC
|
REAC:R-HSA-9010553
|
Regulation of expression of SLITs and ROBOs
|
5.50698668624597e-20
|
171
|
17
|
13
|
0.764705882352941
|
0.0760233918128655
|
|
REAC
|
REAC:R-HSA-975957
|
Nonsense Mediated Decay (NMD) enhanced by the Exon Junction Complex (EJC)
|
6.55867036545421e-20
|
116
|
17
|
12
|
0.705882352941177
|
0.103448275862069
|
|
REAC
|
REAC:R-HSA-927802
|
Nonsense-Mediated Decay (NMD)
|
6.55867036545421e-20
|
116
|
17
|
12
|
0.705882352941177
|
0.103448275862069
|
|
REAC
|
REAC:R-HSA-2408522
|
Selenoamino acid metabolism
|
6.87529504899694e-20
|
117
|
17
|
12
|
0.705882352941177
|
0.102564102564103
|
|
REAC
|
REAC:R-HSA-168273
|
Influenza Viral RNA Transcription and Replication
|
3.22703989624665e-19
|
133
|
17
|
12
|
0.705882352941177
|
0.0902255639097744
|
|
REAC
|
REAC:R-HSA-72766
|
Translation
|
3.8521116582788e-19
|
292
|
17
|
14
|
0.823529411764706
|
0.0479452054794521
|
|
REAC
|
REAC:R-HSA-376176
|
Signaling by ROBO receptors
|
9.28531984490092e-19
|
217
|
17
|
13
|
0.764705882352941
|
0.0599078341013825
|
|
REAC
|
REAC:R-HSA-168255
|
Influenza Infection
|
1.45409513821657e-18
|
152
|
17
|
12
|
0.705882352941177
|
0.0789473684210526
|
|
REAC
|
REAC:R-HSA-9711097
|
Cellular response to starvation
|
2.0721440822369e-18
|
157
|
17
|
12
|
0.705882352941177
|
0.0764331210191083
|
|
REAC
|
REAC:R-HSA-6791226
|
Major pathway of rRNA processing in the nucleolus and cytosol
|
1.31187861600134e-17
|
183
|
17
|
12
|
0.705882352941177
|
0.0655737704918033
|
|
REAC
|
REAC:R-HSA-8868773
|
rRNA processing in the nucleus and cytosol
|
2.41665587903613e-17
|
193
|
17
|
12
|
0.705882352941177
|
0.0621761658031088
|
|
REAC
|
REAC:R-HSA-72312
|
rRNA processing
|
4.30951831074587e-17
|
203
|
17
|
12
|
0.705882352941177
|
0.0591133004926108
|
|
REAC
|
REAC:R-HSA-71291
|
Metabolism of amino acids and derivatives
|
5.6322560956329e-14
|
368
|
17
|
12
|
0.705882352941177
|
0.0326086956521739
|
|
REAC
|
REAC:R-HSA-2262752
|
Cellular responses to stress
|
1.23477321166922e-13
|
546
|
17
|
13
|
0.764705882352941
|
0.0238095238095238
|
|
REAC
|
REAC:R-HSA-422475
|
Axon guidance
|
1.27817803227475e-13
|
549
|
17
|
13
|
0.764705882352941
|
0.0236794171220401
|
|
REAC
|
REAC:R-HSA-8953897
|
Cellular responses to external stimuli
|
1.59520834602968e-13
|
560
|
17
|
13
|
0.764705882352941
|
0.0232142857142857
|
|
REAC
|
REAC:R-HSA-9675108
|
Nervous system development
|
2.12201573907855e-13
|
574
|
17
|
13
|
0.764705882352941
|
0.0226480836236934
|
|
REAC
|
REAC:R-HSA-8953854
|
Metabolism of RNA
|
2.99782011901223e-12
|
658
|
21
|
14
|
0.666666666666667
|
0.0212765957446809
|
|
REAC
|
REAC:R-HSA-5663205
|
Infectious disease
|
1.804427005825e-11
|
815
|
17
|
13
|
0.764705882352941
|
0.0159509202453988
|
|
REAC
|
REAC:R-HSA-1266738
|
Developmental Biology
|
3.70707203643774e-10
|
1069
|
12
|
11
|
0.916666666666667
|
0.010289990645463
|
|
REAC
|
REAC:R-HSA-392499
|
Metabolism of proteins
|
2.91657627208762e-09
|
1961
|
17
|
15
|
0.882352941176471
|
0.00764915859255482
|
|
REAC
|
REAC:R-HSA-1643685
|
Disease
|
1.50709142457122e-08
|
1509
|
12
|
11
|
0.916666666666667
|
0.00728959575878065
|
|
REAC
|
REAC:R-HSA-72695
|
Formation of the ternary complex, and subsequently, the 43S complex
|
1.93575217571952e-06
|
52
|
15
|
4
|
0.266666666666667
|
0.0769230769230769
|
|
REAC
|
REAC:R-HSA-72649
|
Translation initiation complex formation
|
3.06497363931696e-06
|
59
|
15
|
4
|
0.266666666666667
|
0.0677966101694915
|
|
REAC
|
REAC:R-HSA-72702
|
Ribosomal scanning and start codon recognition
|
3.06497363931696e-06
|
59
|
15
|
4
|
0.266666666666667
|
0.0677966101694915
|
|
REAC
|
REAC:R-HSA-72662
|
Activation of the mRNA upon binding of the cap-binding complex and eIFs, and subsequent binding to 43S
|
3.19701955678767e-06
|
60
|
15
|
4
|
0.266666666666667
|
0.0666666666666667
|
|
REAC
|
REAC:R-HSA-1430728
|
Metabolism
|
9.42725927832318e-06
|
2070
|
12
|
10
|
0.833333333333333
|
0.00483091787439614
|
|
TF
|
TF:M00191
|
Factor: ER; motif: NNARGNCANNNTGACCYNN
|
0.0392403183197384
|
4848
|
13
|
11
|
0.846153846153846
|
0.00226897689768977
|
|
WP
|
WP:WP477
|
Cytoplasmic Ribosomal Proteins
|
2.59994349614018e-19
|
90
|
17
|
12
|
0.705882352941177
|
0.133333333333333
|
