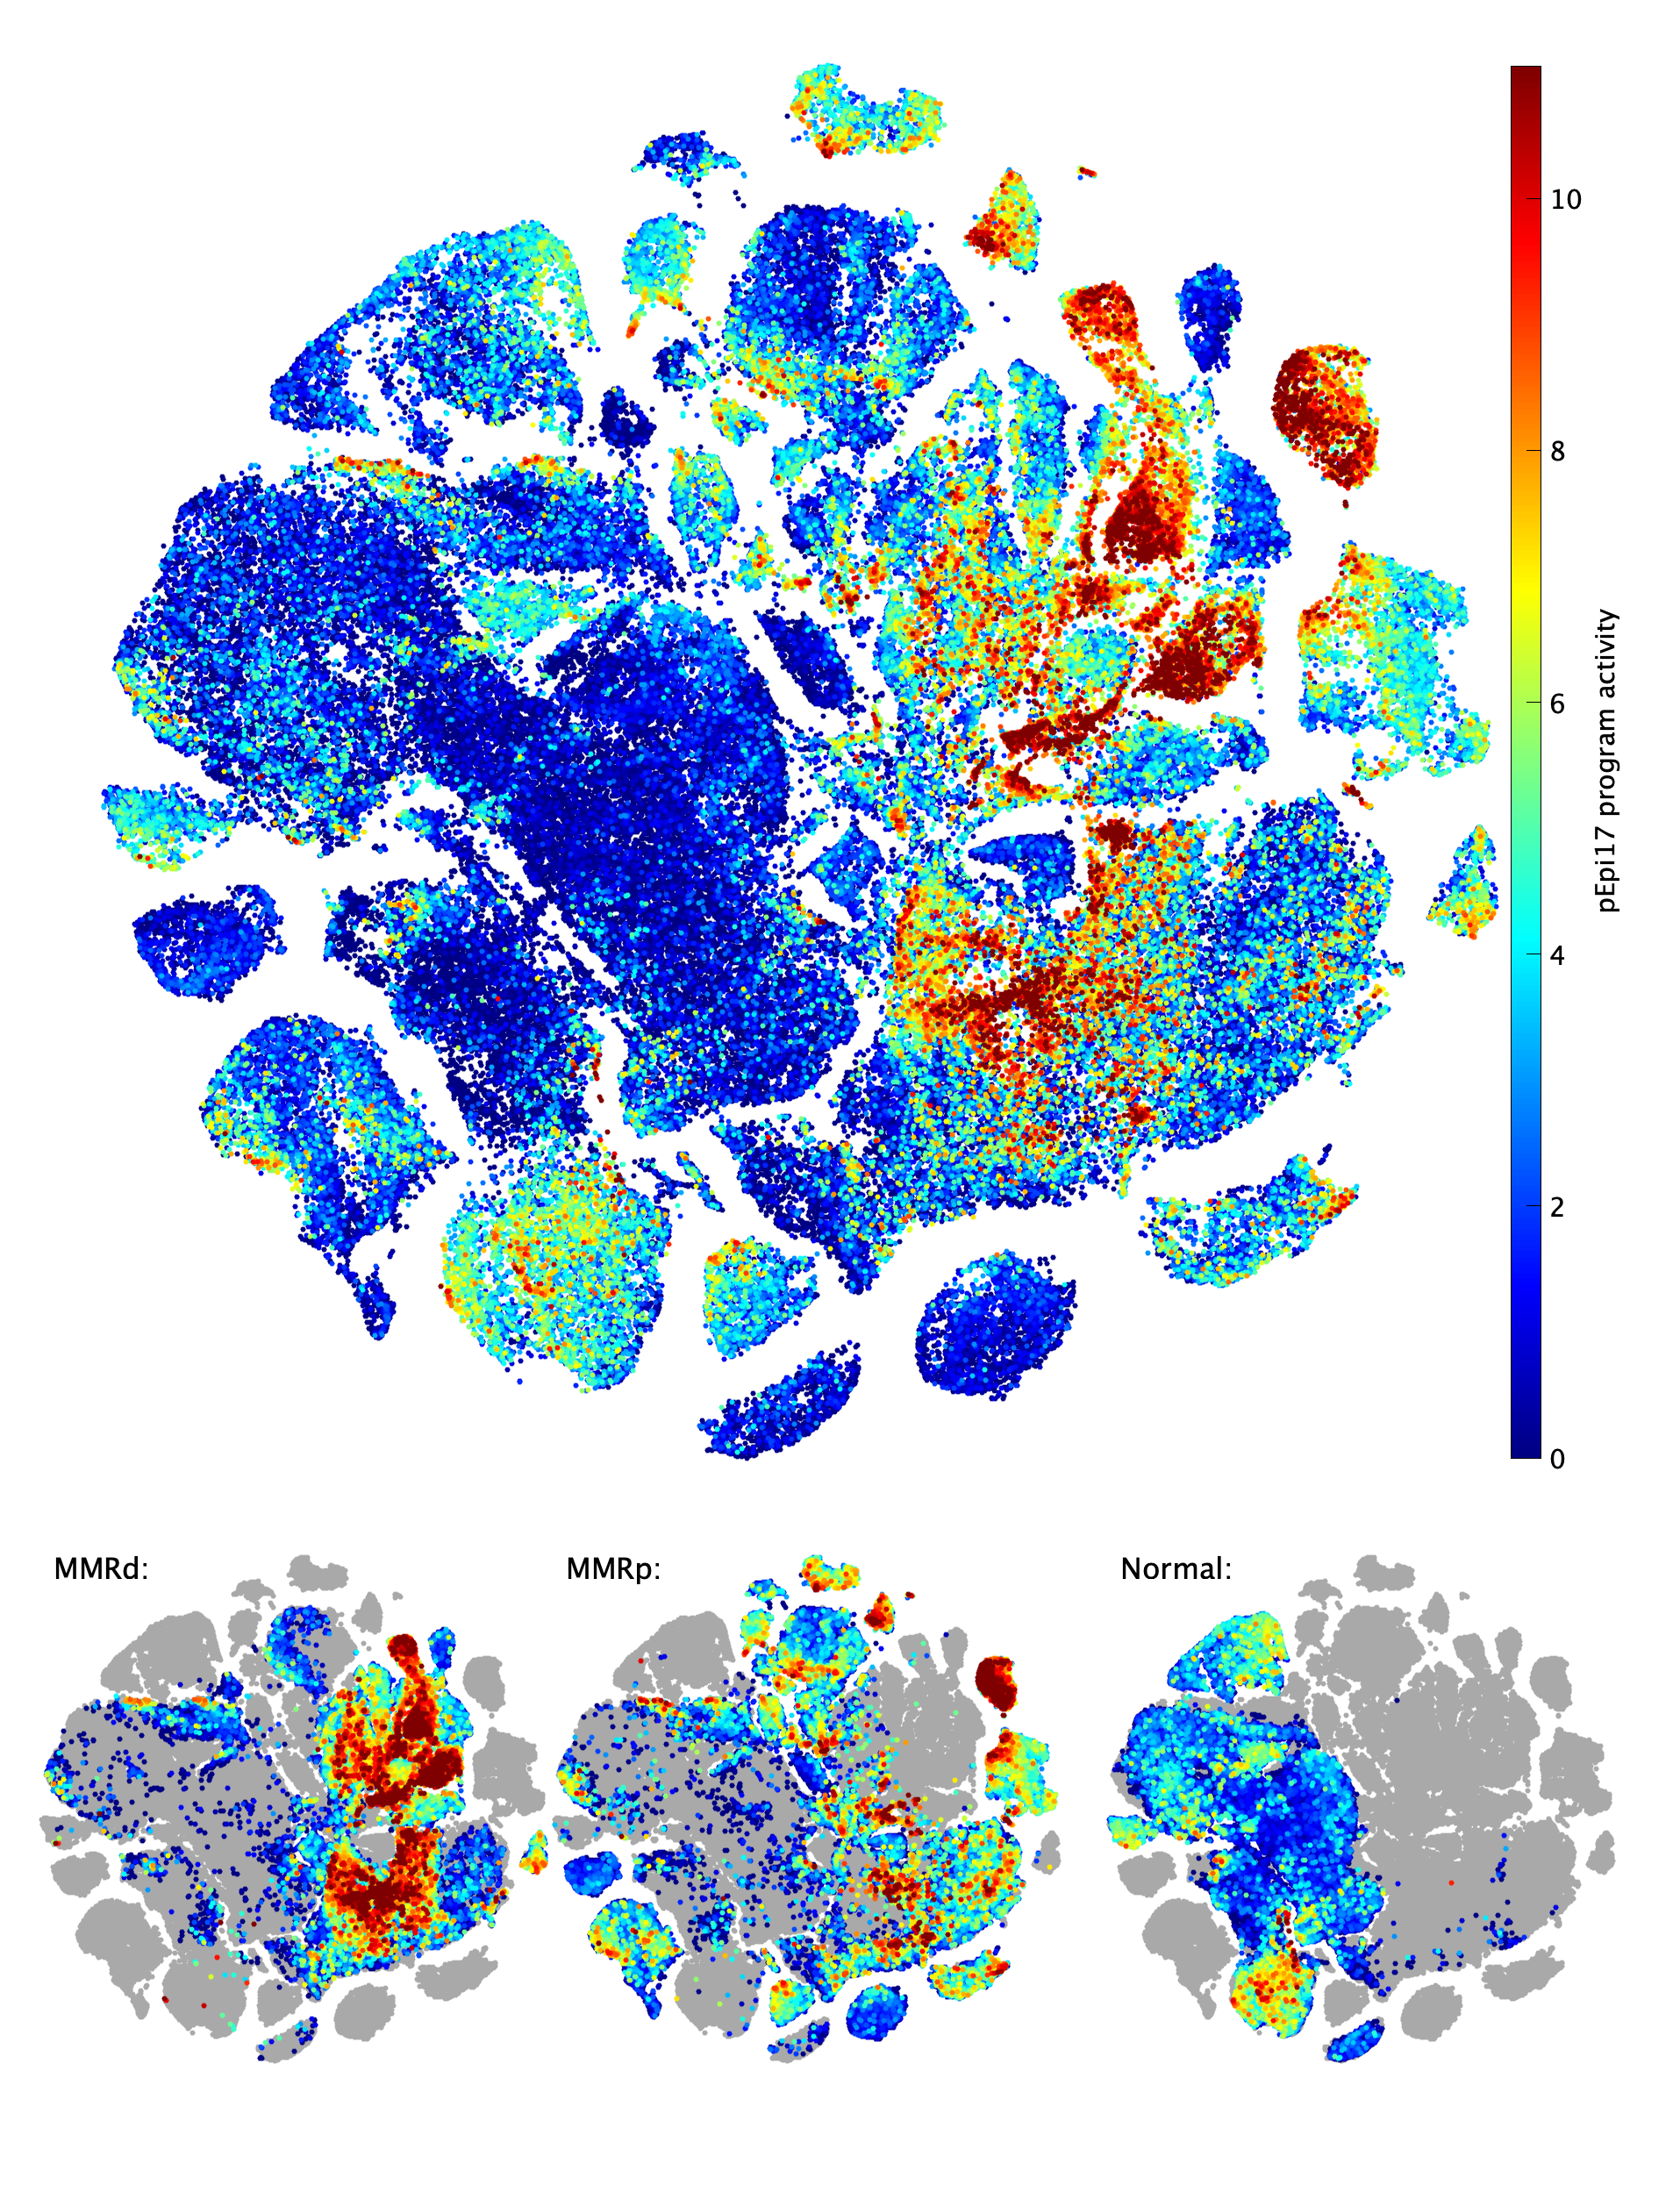
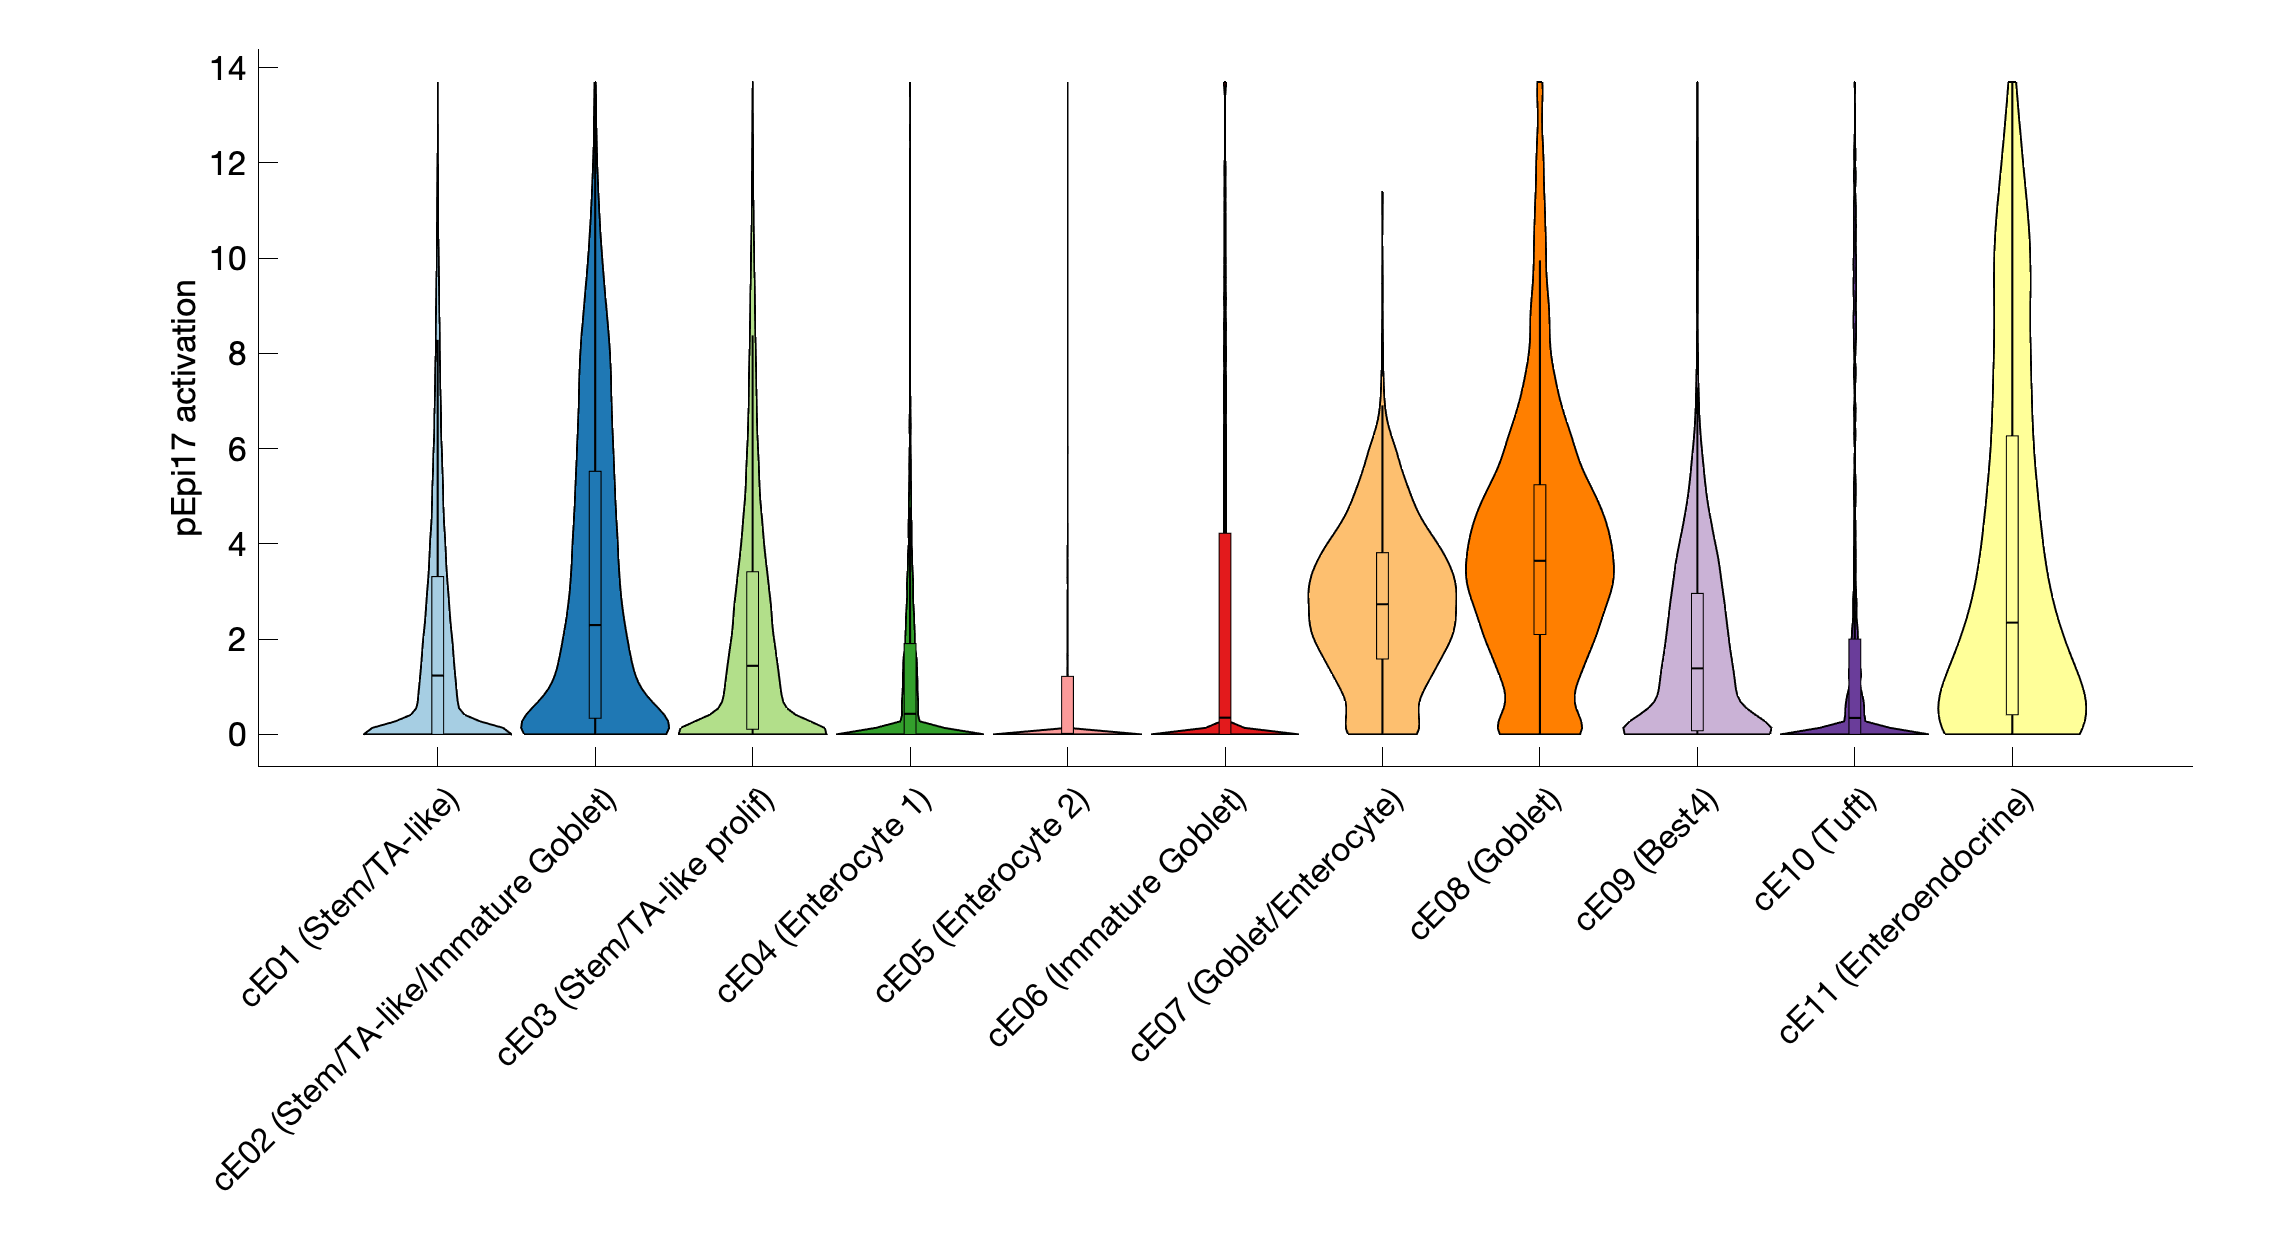
pEpi17 program activity among Epithelial cells

Activation of pEpi17
pEpi17 gene program activation in Epithelial cells. (Top) Activation of program across all epithelial cells. (Bottom) Activation in MMRd (left), MMRp (middle), and normal epithelial cells (right).

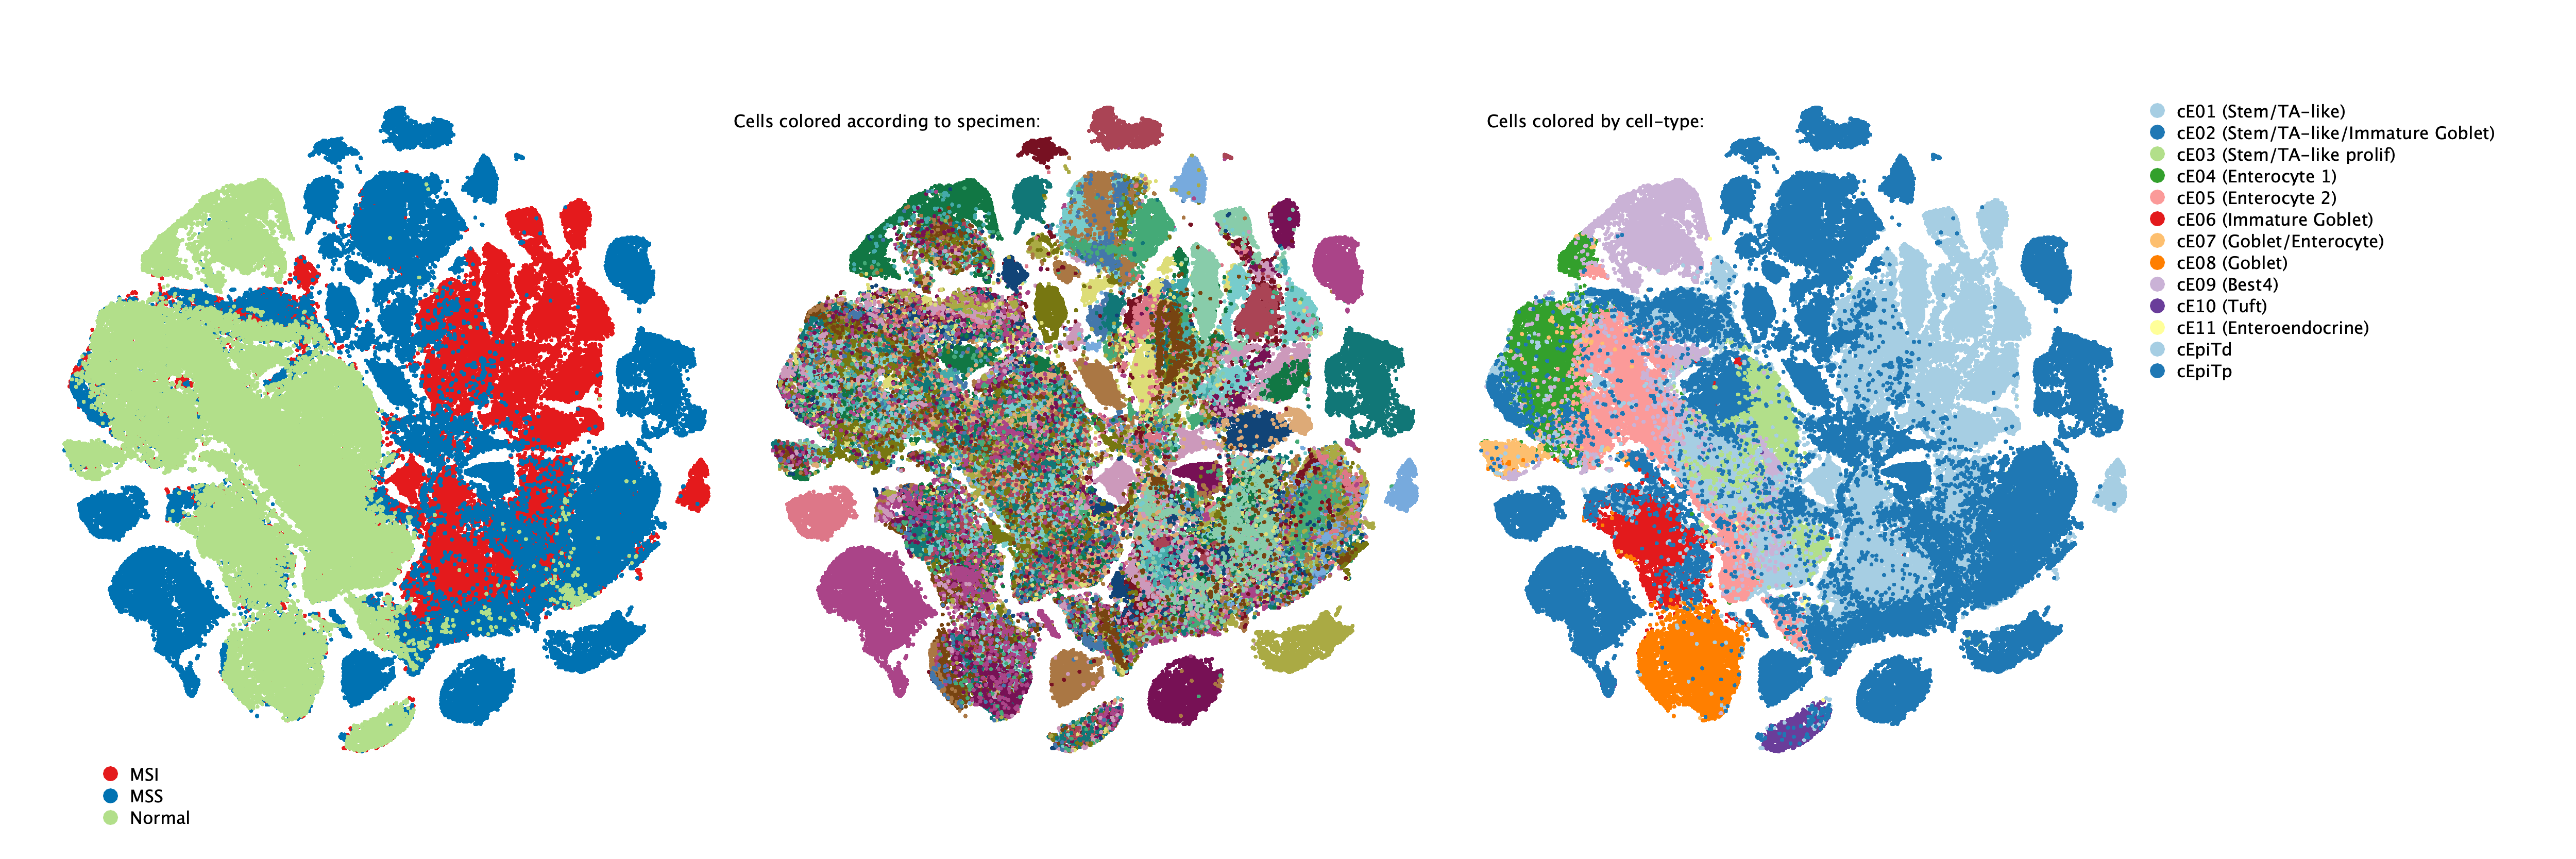
Epithelial cell compositional overview

Overview of epithelial cell composition
Overview of epithelial cell composition. A tSNE plot colored by: (left) MMR status of epithelial cells, (middle) specimen, (righ) epithelial cell sub-type.
Gene program activation of pEpi17 by different cell subtypes
pEpi17 gene program activation among cells of different subtypes (Epithelial cells).

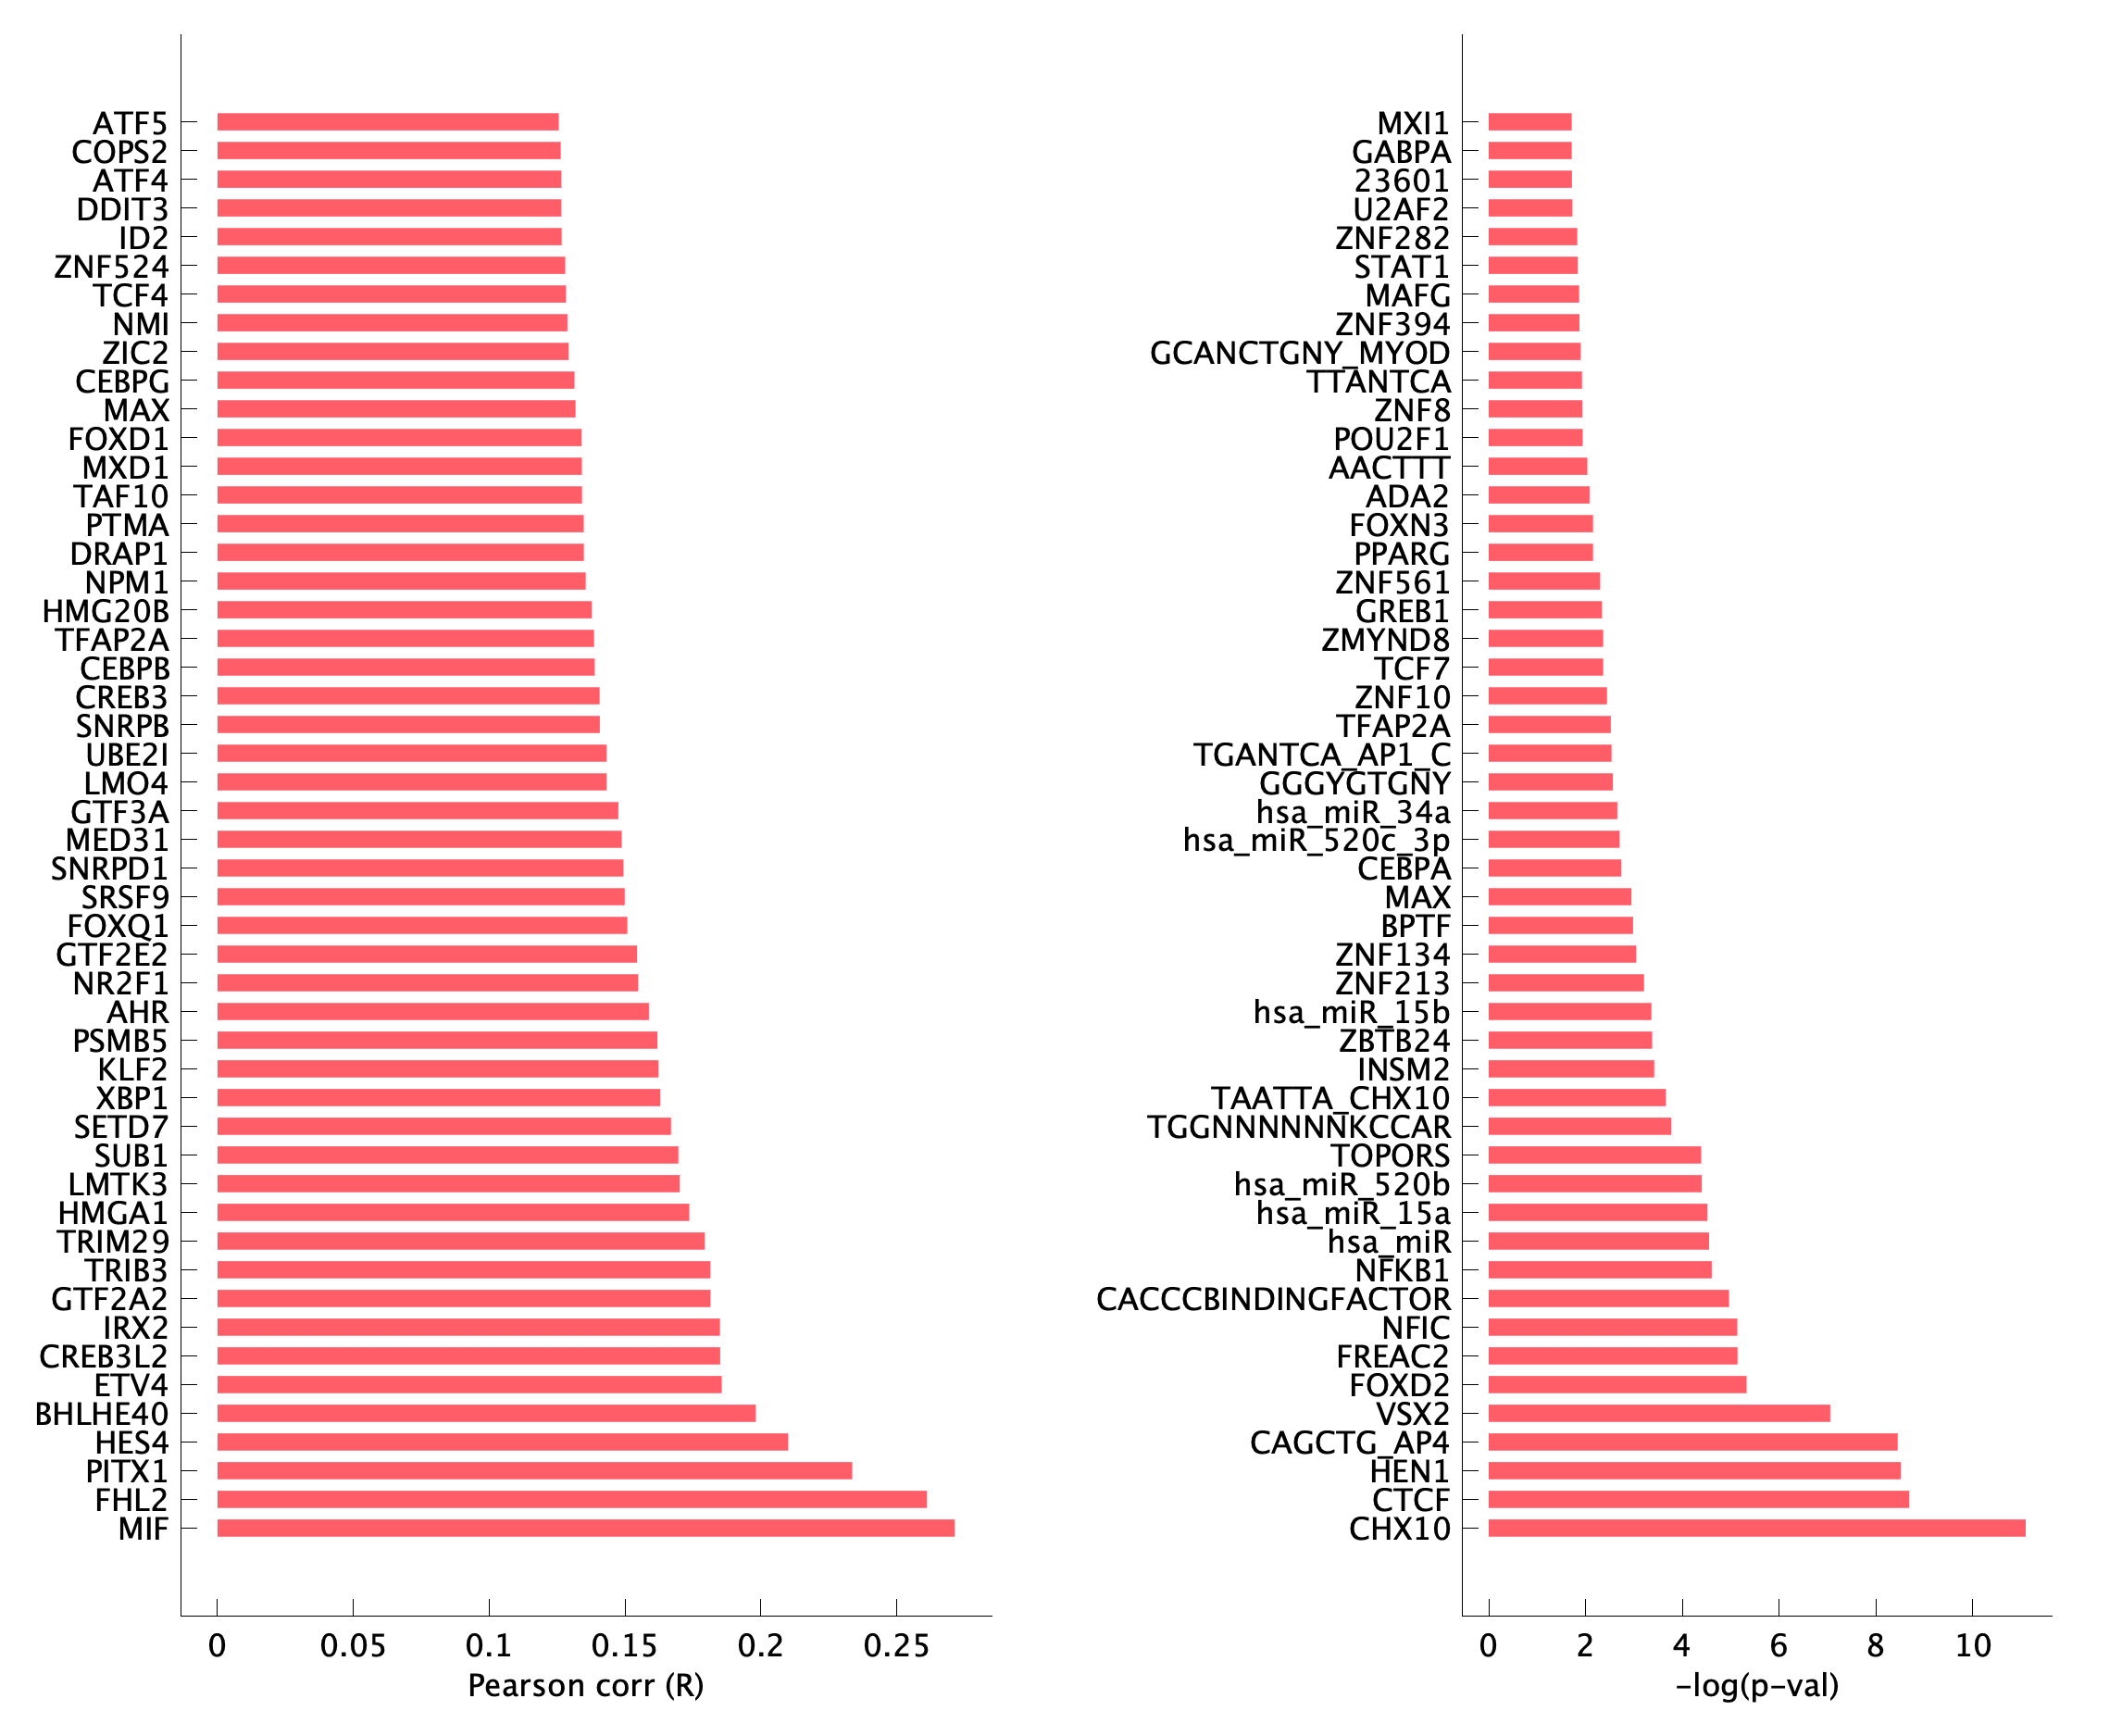
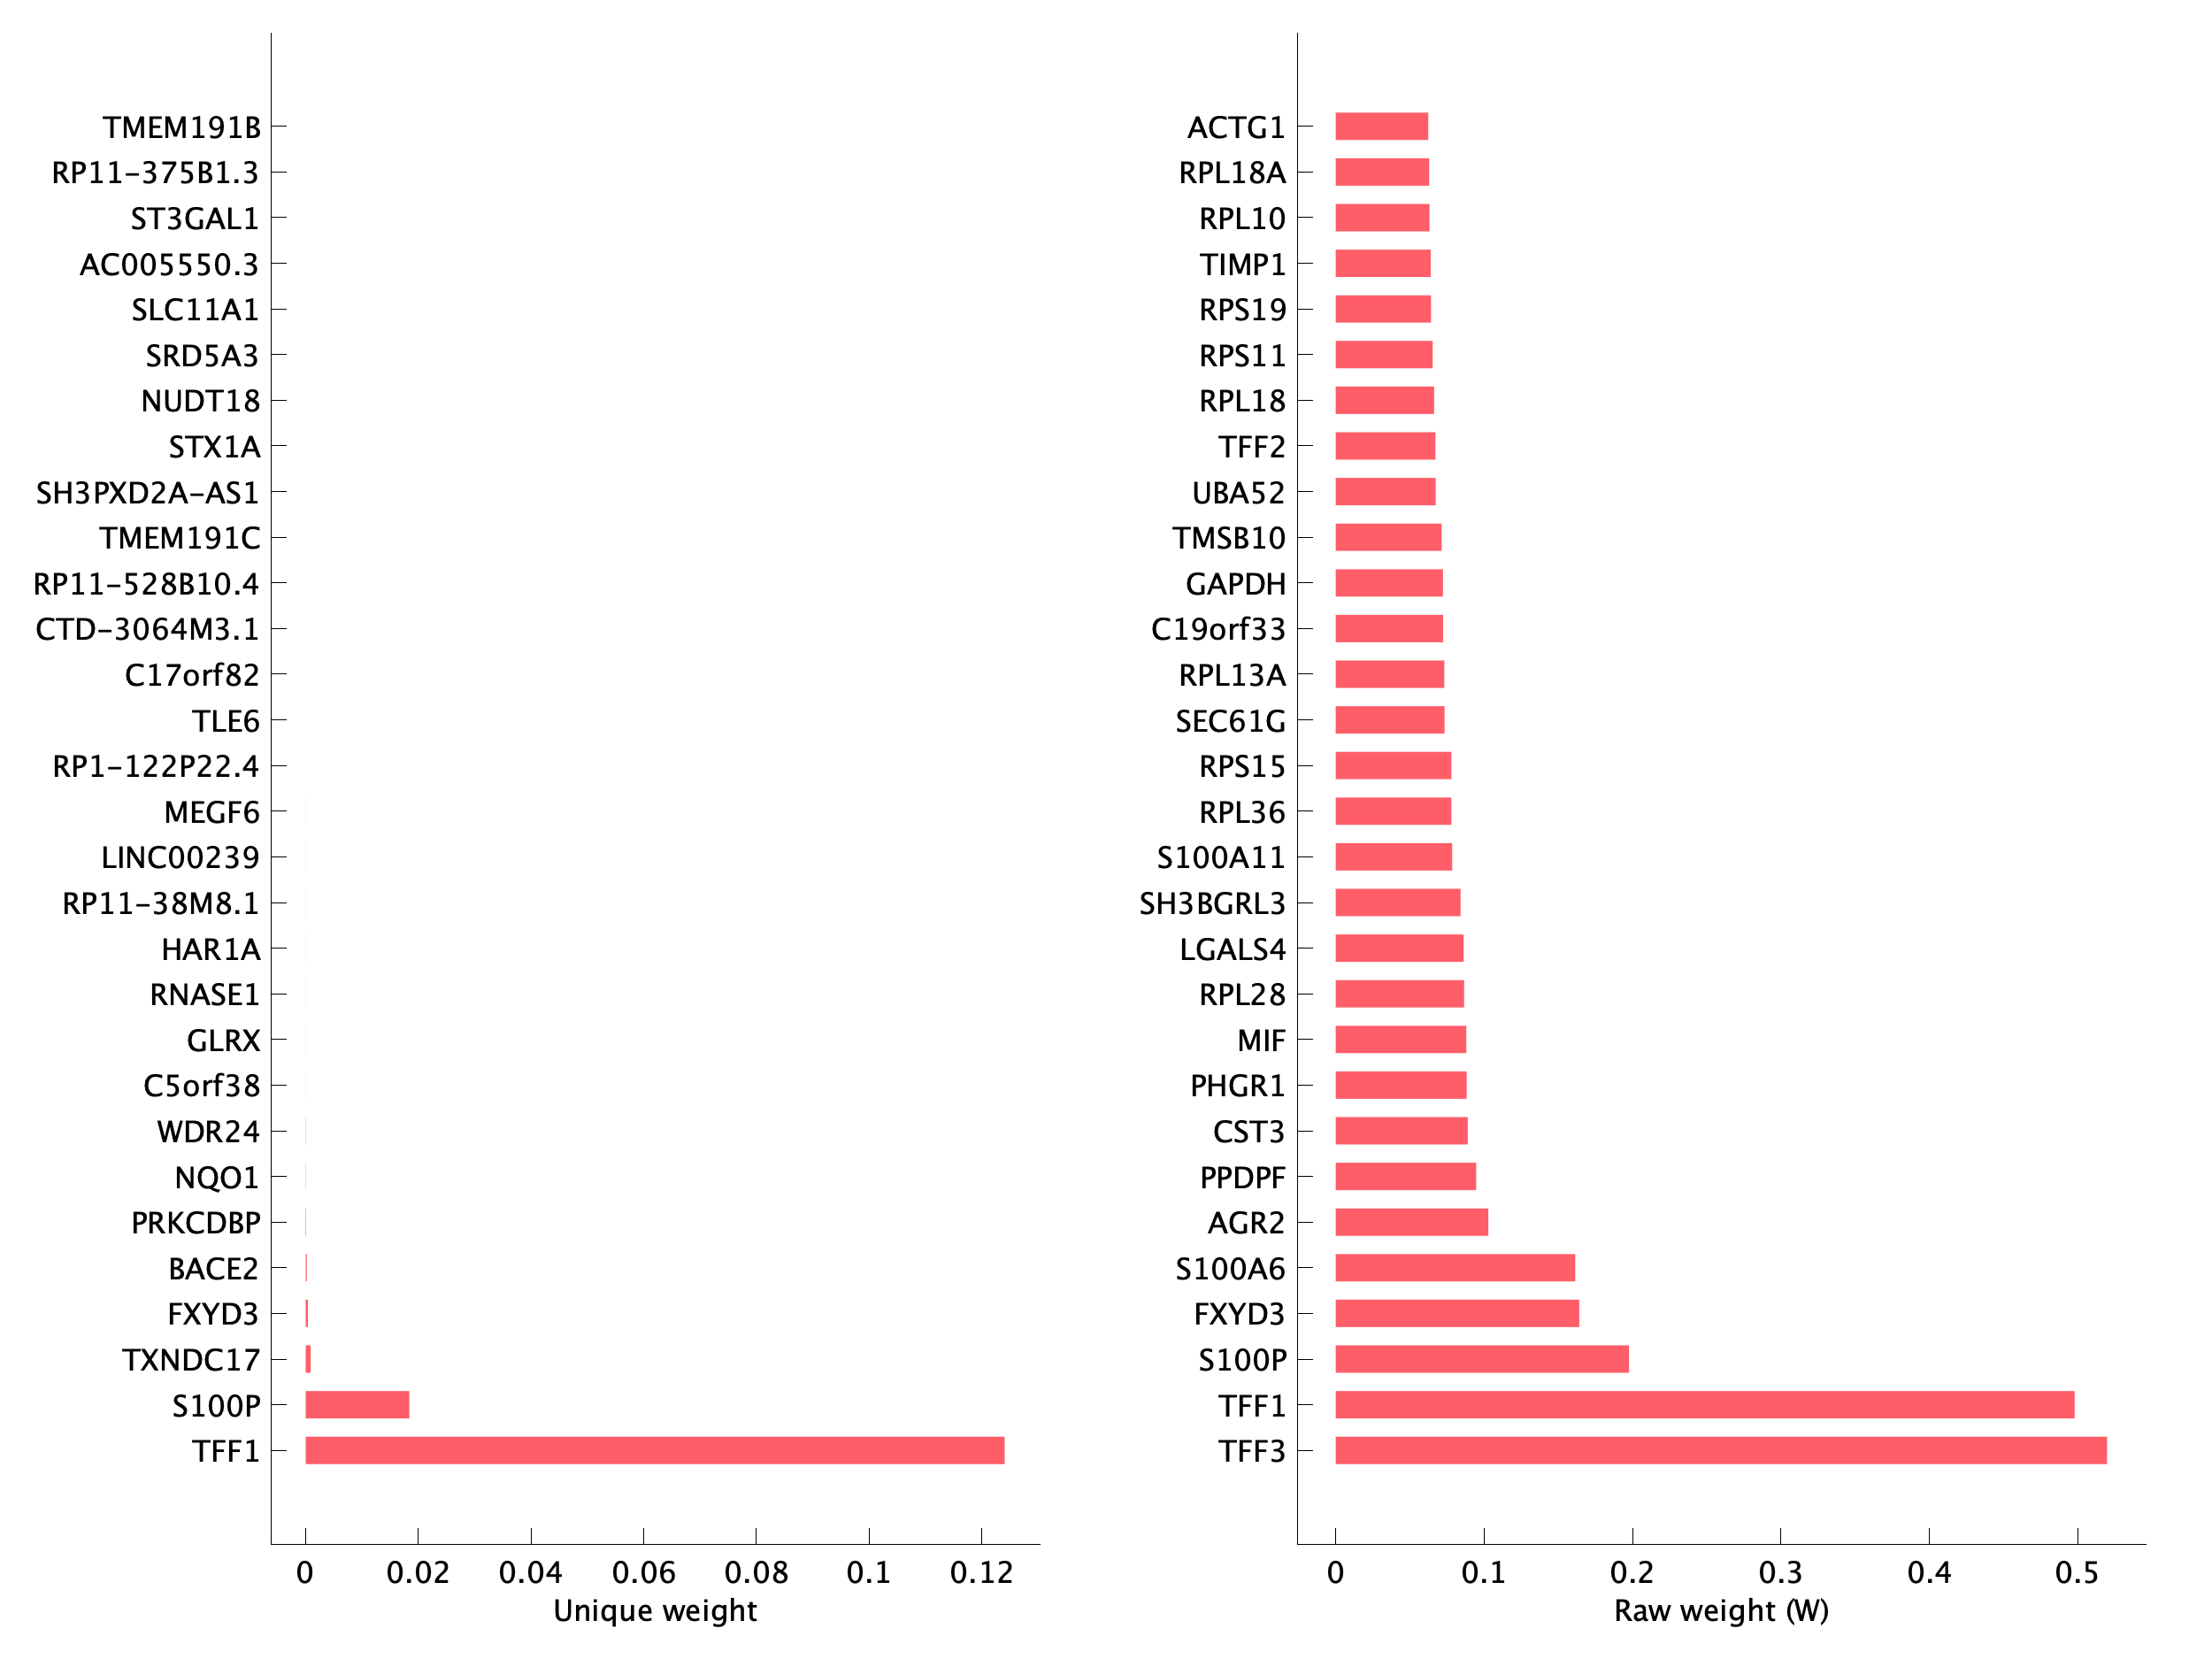
pEpi17 top program genes

Top genes of pEpi17 program
Bar plots showing the top genes for each gene program, ranked by (left) unique weights, (right) raw weights.

pEpi17 gene-set enrichment of top program genes (using g-profiler)
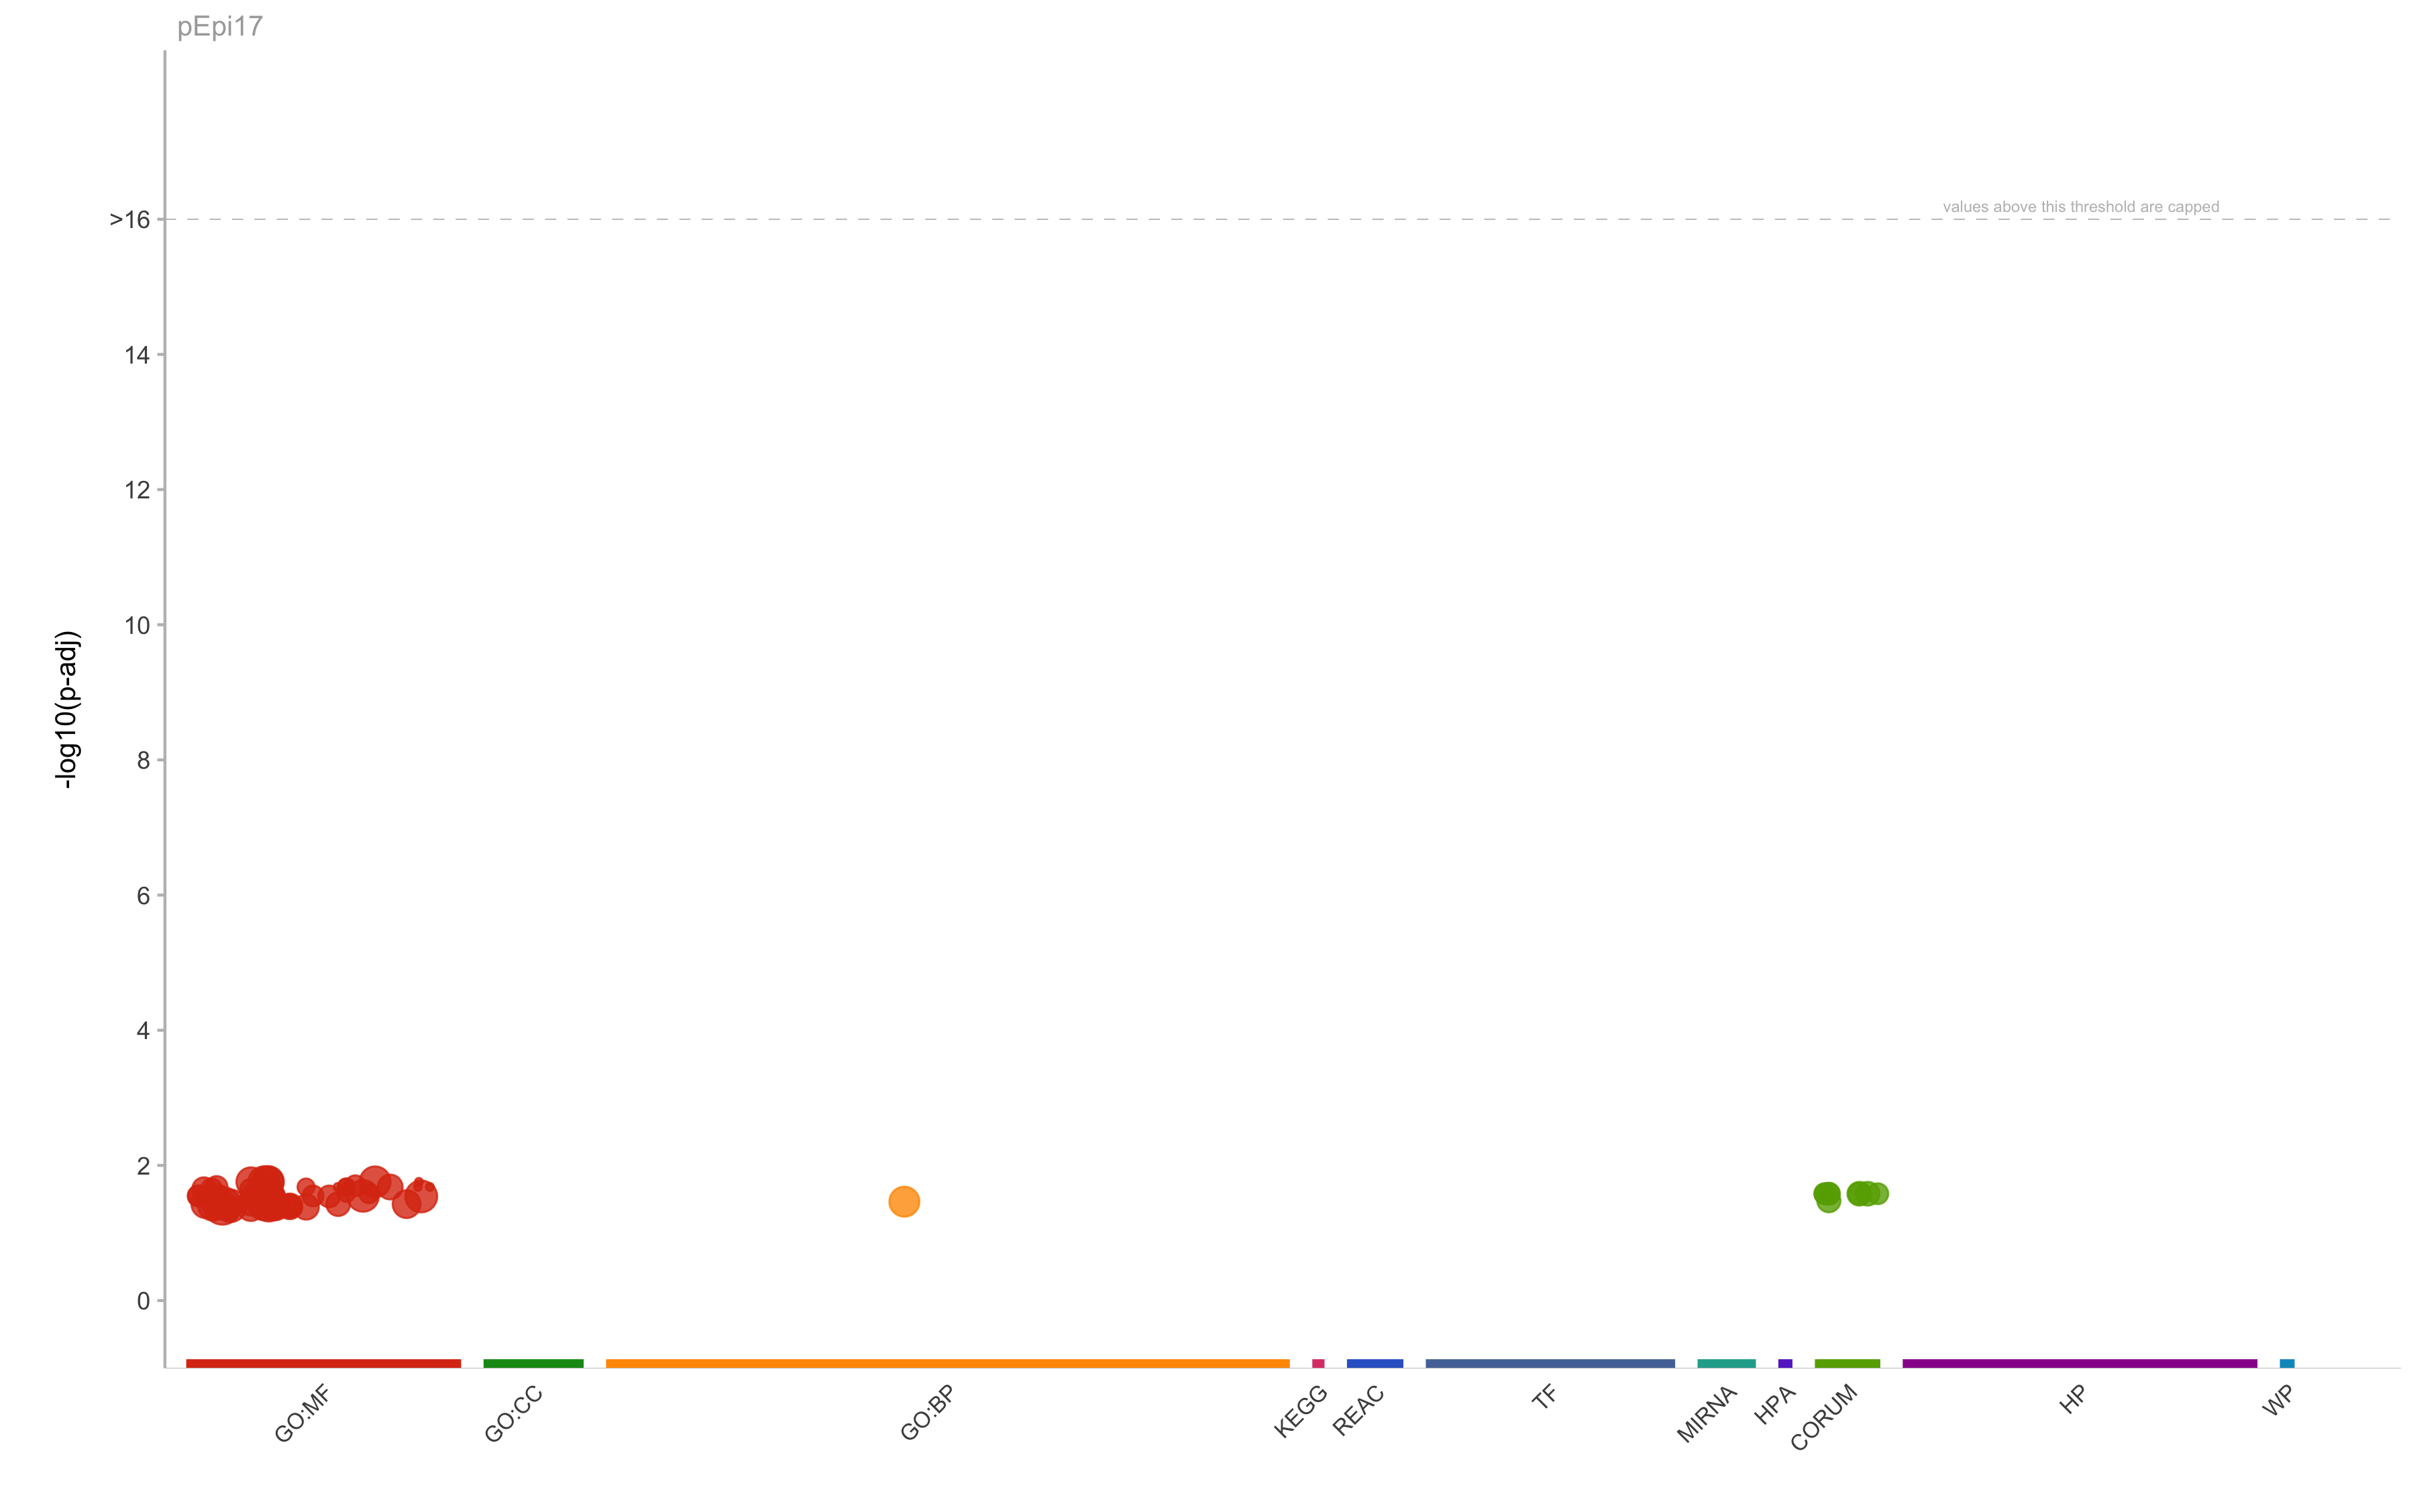
GSEA wth gene profiler of pEpi17
pEpi17 gene-set enrichment summary using g-profiler webtool.
Source termID Name Padj Tsize Qsize Overlap Precision Recall
GO:BP GO:0045454 cell redox homeostasis 0.0344178244270067 58 19 3 0.157894736842105 0.0517241379310345
GO:MF GO:0048306 calcium-dependent protein binding 0.0175091025915747 82 30 3 0.1 0.0365853658536585
GO:MF GO:0016491 oxidoreductase activity 0.0287749065186658 771 9 3 0.333333333333333 0.00389105058365759

pEpi17 transcription factor target enrichment of top program genes

TF enrichment of pEpi17
Possible regulators of activation of pEpi17 in epithelial cells. (Left) pearson correlation of TF expression and gene expression program activatity in Epithelial cells, (right) negative log p-value for enrichment of TF binding sites among top uniqueness weighted genes for the gene program. Blue bars indicate significant TFs meeting the following criteria: FDR<0.1, overlap > 2, Corr. R > 0, permutation based p-value < 0.05.