|
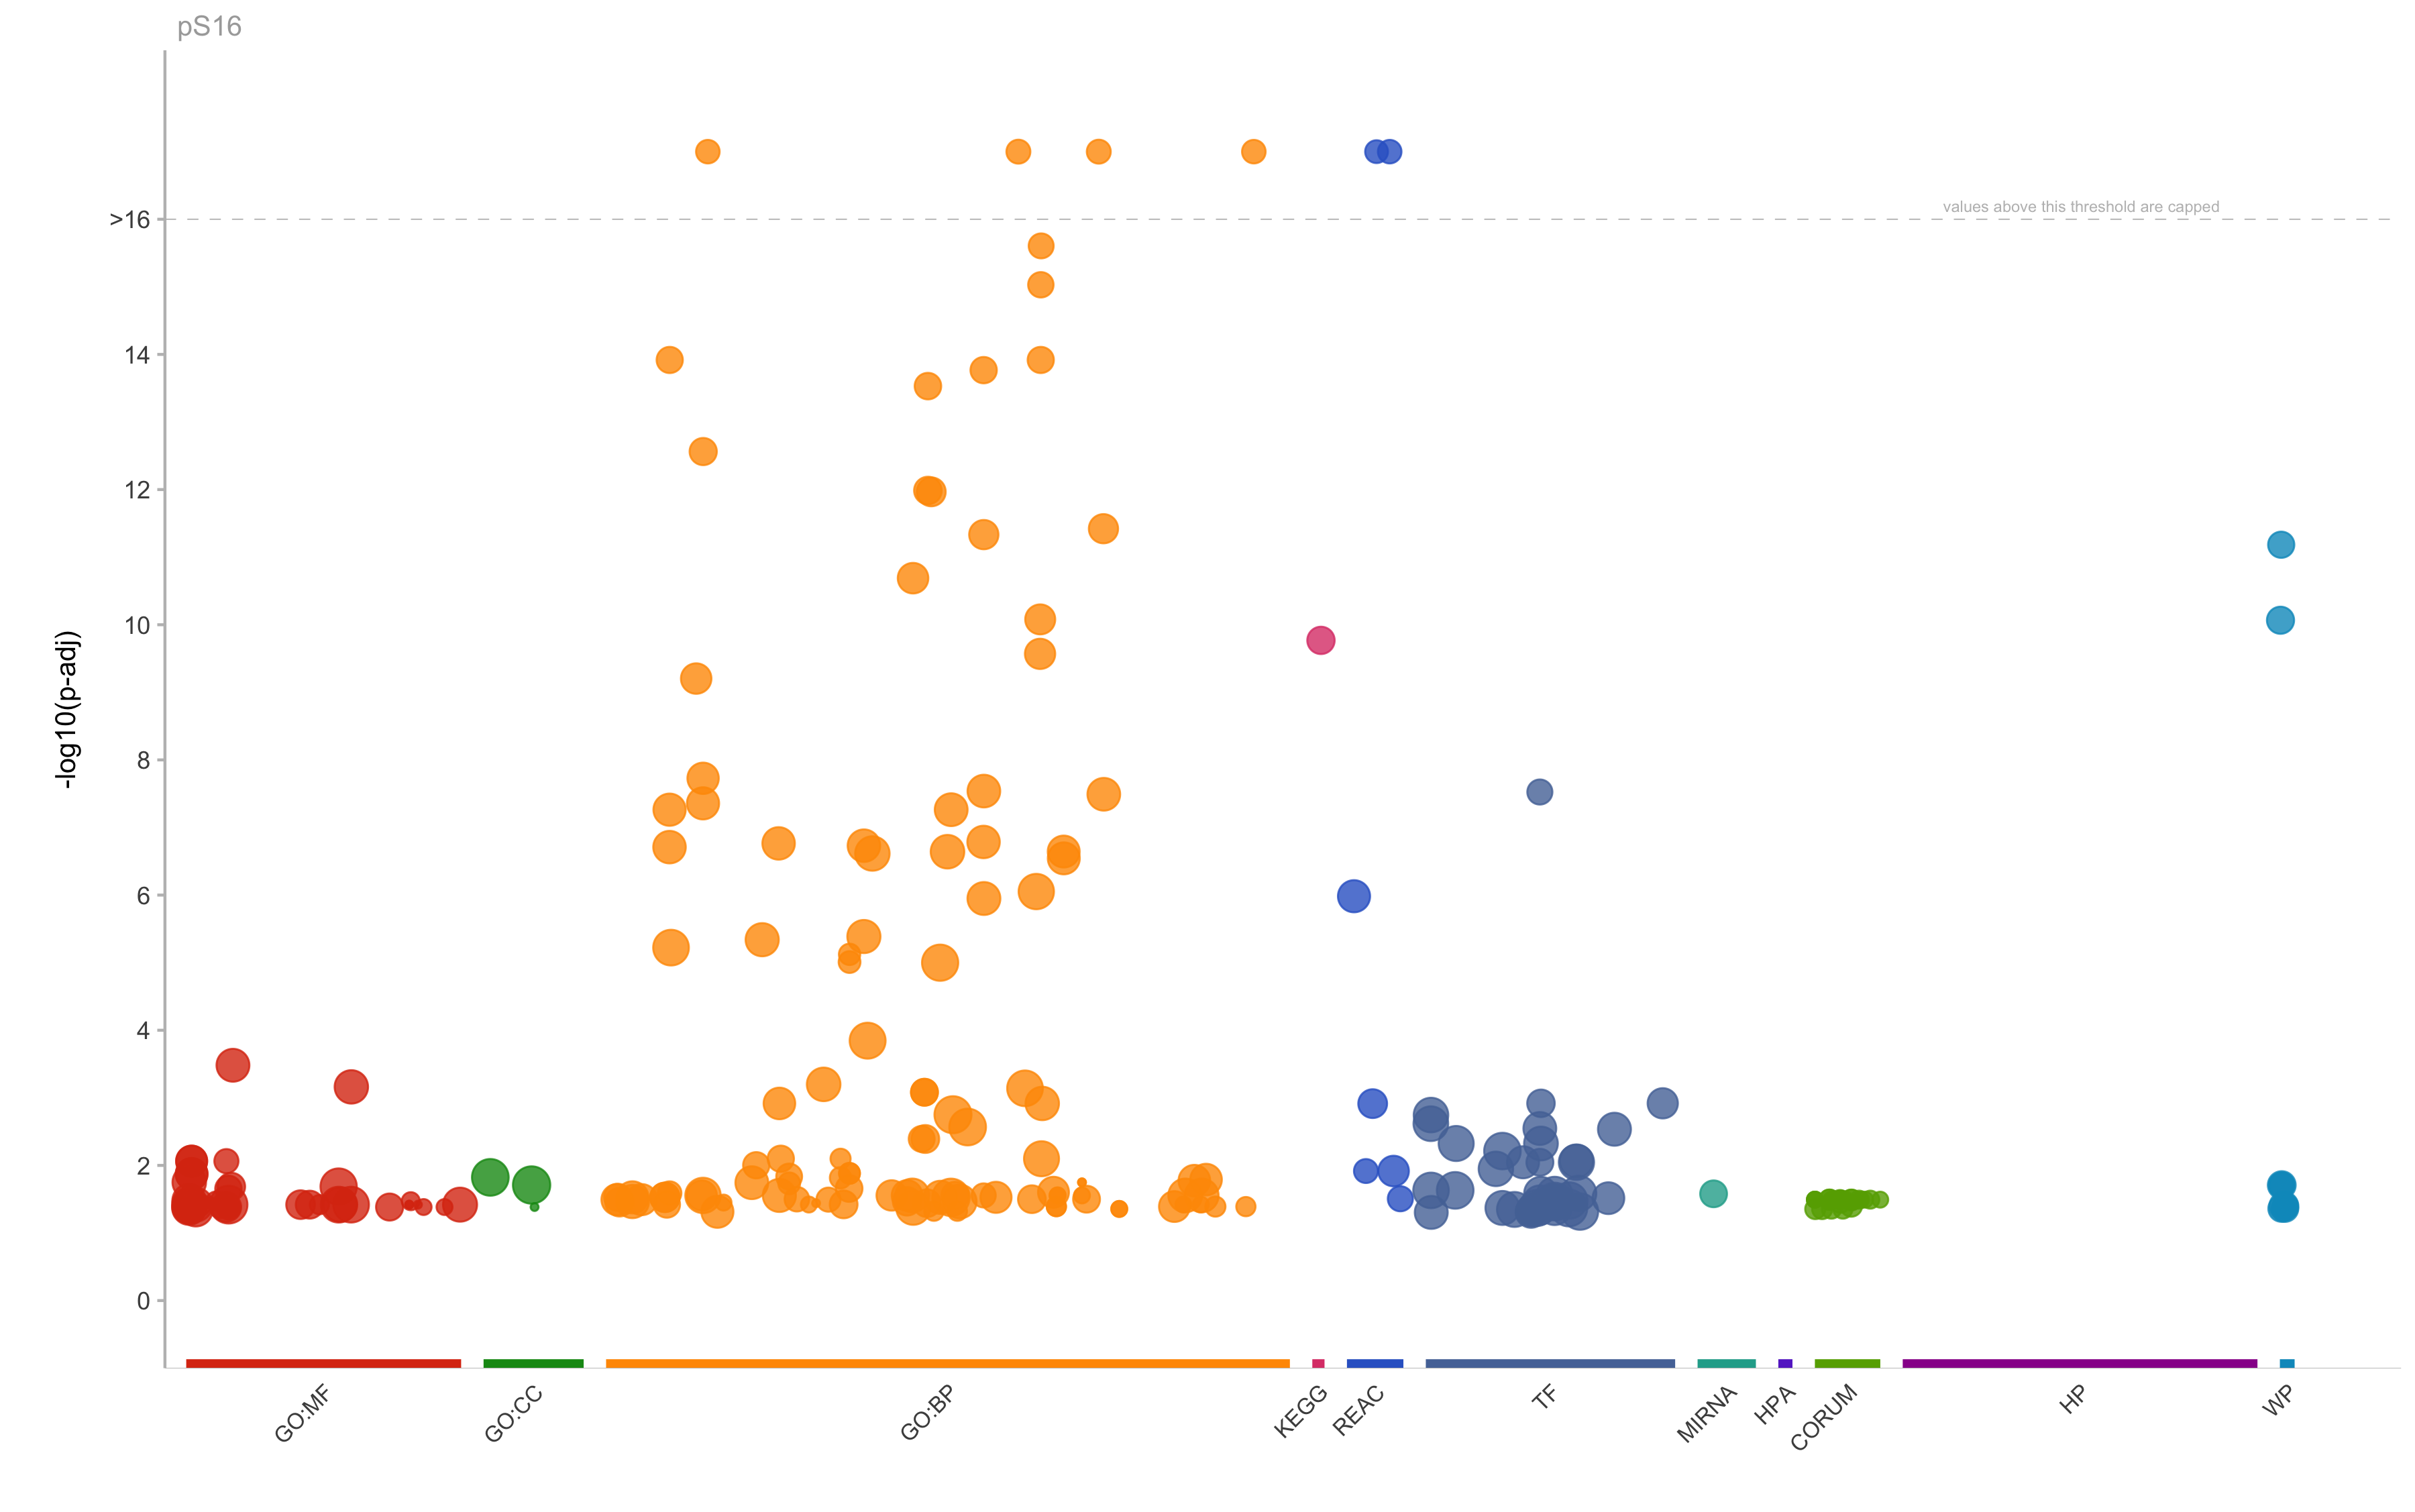
GO:BP
|
GO:0010273
|
detoxification of copper ion
|
3.81983858213361e-18
|
14
|
22
|
8
|
0.363636363636364
|
0.571428571428571
|
|
GO:BP
|
GO:1990169
|
stress response to copper ion
|
3.81983858213361e-18
|
14
|
22
|
8
|
0.363636363636364
|
0.571428571428571
|
|
GO:BP
|
GO:0097501
|
stress response to metal ion
|
8.17411933616746e-18
|
16
|
22
|
8
|
0.363636363636364
|
0.5
|
|
GO:BP
|
GO:0061687
|
detoxification of inorganic compound
|
8.17411933616746e-18
|
16
|
22
|
8
|
0.363636363636364
|
0.5
|
|
GO:BP
|
GO:0071294
|
cellular response to zinc ion
|
2.47933907021604e-16
|
23
|
22
|
8
|
0.363636363636364
|
0.347826086956522
|
|
GO:BP
|
GO:0071280
|
cellular response to copper ion
|
9.32938524145901e-16
|
27
|
22
|
8
|
0.363636363636364
|
0.296296296296296
|
|
GO:BP
|
GO:0006882
|
cellular zinc ion homeostasis
|
1.2084698073866e-14
|
37
|
22
|
8
|
0.363636363636364
|
0.216216216216216
|
|
GO:BP
|
GO:0071276
|
cellular response to cadmium ion
|
1.2084698073866e-14
|
37
|
22
|
8
|
0.363636363636364
|
0.216216216216216
|
|
GO:BP
|
GO:0055069
|
zinc ion homeostasis
|
1.70942761597282e-14
|
39
|
22
|
8
|
0.363636363636364
|
0.205128205128205
|
|
GO:BP
|
GO:0046688
|
response to copper ion
|
2.94541642481572e-14
|
42
|
22
|
8
|
0.363636363636364
|
0.19047619047619
|
|
GO:BP
|
GO:0010043
|
response to zinc ion
|
2.73757516236113e-13
|
55
|
22
|
8
|
0.363636363636364
|
0.145454545454545
|
|
GO:BP
|
GO:0046686
|
response to cadmium ion
|
1.03314000703607e-12
|
65
|
22
|
8
|
0.363636363636364
|
0.123076923076923
|
|
GO:BP
|
GO:0046916
|
cellular transition metal ion homeostasis
|
1.08058011164194e-12
|
116
|
22
|
9
|
0.409090909090909
|
0.0775862068965517
|
|
GO:BP
|
GO:0098754
|
detoxification
|
3.79480995774141e-12
|
134
|
22
|
9
|
0.409090909090909
|
0.0671641791044776
|
|
GO:BP
|
GO:0055076
|
transition metal ion homeostasis
|
4.64083545248989e-12
|
138
|
22
|
9
|
0.409090909090909
|
0.0652173913043478
|
|
GO:BP
|
GO:0045926
|
negative regulation of growth
|
2.04664713889405e-11
|
255
|
22
|
10
|
0.454545454545455
|
0.0392156862745098
|
|
GO:BP
|
GO:0071248
|
cellular response to metal ion
|
8.3332025393043e-11
|
192
|
22
|
9
|
0.409090909090909
|
0.046875
|
|
GO:BP
|
GO:0071241
|
cellular response to inorganic substance
|
2.69658085382053e-10
|
220
|
22
|
9
|
0.409090909090909
|
0.0409090909090909
|
|
GO:BP
|
GO:0009636
|
response to toxic substance
|
6.25693689163765e-10
|
243
|
22
|
9
|
0.409090909090909
|
0.037037037037037
|
|
GO:BP
|
GO:0010038
|
response to metal ion
|
1.86997542595296e-08
|
371
|
15
|
8
|
0.533333333333333
|
0.0215633423180593
|
|
GO:BP
|
GO:0055080
|
cation homeostasis
|
2.89266270958792e-08
|
750
|
22
|
11
|
0.5
|
0.0146666666666667
|
|
GO:BP
|
GO:0098771
|
inorganic ion homeostasis
|
3.22373293577338e-08
|
761
|
22
|
11
|
0.5
|
0.0144546649145861
|
|
GO:BP
|
GO:0010035
|
response to inorganic substance
|
4.39360469996674e-08
|
575
|
22
|
10
|
0.454545454545455
|
0.0173913043478261
|
|
GO:BP
|
GO:0050801
|
ion homeostasis
|
5.45360004392724e-08
|
808
|
22
|
11
|
0.5
|
0.0136138613861386
|
|
GO:BP
|
GO:0006875
|
cellular metal ion homeostasis
|
5.45360004392724e-08
|
593
|
22
|
10
|
0.454545454545455
|
0.0168634064080944
|
|
GO:BP
|
GO:0055065
|
metal ion homeostasis
|
1.63729534808817e-07
|
667
|
22
|
10
|
0.454545454545455
|
0.0149925037481259
|
|
GO:BP
|
GO:0030003
|
cellular cation homeostasis
|
1.71899197505892e-07
|
673
|
22
|
10
|
0.454545454545455
|
0.0148588410104012
|
|
GO:BP
|
GO:0040008
|
regulation of growth
|
1.85774174806359e-07
|
681
|
22
|
10
|
0.454545454545455
|
0.0146842878120411
|
|
GO:BP
|
GO:0006873
|
cellular ion homeostasis
|
1.95197734710833e-07
|
687
|
22
|
10
|
0.454545454545455
|
0.0145560407569141
|
|
GO:BP
|
GO:0072503
|
cellular divalent inorganic cation homeostasis
|
2.26869875913068e-07
|
497
|
22
|
9
|
0.409090909090909
|
0.0181086519114688
|
|
GO:BP
|
GO:0048878
|
chemical homeostasis
|
2.28197083102614e-07
|
1229
|
22
|
12
|
0.545454545454545
|
0.00976403580146461
|
|
GO:BP
|
GO:0042592
|
homeostatic process
|
2.42636667348969e-07
|
1981
|
16
|
12
|
0.75
|
0.0060575466935891
|
|
GO:BP
|
GO:0072507
|
divalent inorganic cation homeostasis
|
2.86249429989066e-07
|
516
|
22
|
9
|
0.409090909090909
|
0.0174418604651163
|
|
GO:BP
|
GO:0070887
|
cellular response to chemical stimulus
|
8.86771734222428e-07
|
3393
|
23
|
17
|
0.739130434782609
|
0.00501031535514294
|
|
GO:BP
|
GO:0055082
|
cellular chemical homeostasis
|
1.12387952375513e-06
|
841
|
22
|
10
|
0.454545454545455
|
0.0118906064209275
|
|
GO:BP
|
GO:0040007
|
growth
|
4.10650894837625e-06
|
967
|
22
|
10
|
0.454545454545455
|
0.0103412616339193
|
|
GO:BP
|
GO:0019725
|
cellular homeostasis
|
4.57570664494259e-06
|
981
|
22
|
10
|
0.454545454545455
|
0.0101936799184506
|
|
GO:BP
|
GO:0006950
|
response to stress
|
5.99302091896063e-06
|
4170
|
24
|
18
|
0.75
|
0.00431654676258993
|
|
GO:BP
|
GO:0048519
|
negative regulation of biological process
|
1.0014517068461e-05
|
5757
|
22
|
19
|
0.863636363636364
|
0.0033003300330033
|
|
GO:BP
|
GO:0042221
|
response to chemical
|
0.000142737858781234
|
4781
|
23
|
17
|
0.739130434782609
|
0.00355574147667852
|
|
GO:BP
|
GO:0034097
|
response to cytokine
|
0.000632463053325589
|
1226
|
29
|
10
|
0.344827586206897
|
0.00815660685154975
|
|
GO:BP
|
GO:0065008
|
regulation of biological quality
|
0.000723494207860094
|
4131
|
16
|
12
|
0.75
|
0.00290486564996369
|
|
GO:BP
|
GO:0046464
|
acylglycerol catabolic process
|
0.000826776923982697
|
48
|
58
|
4
|
0.0689655172413793
|
0.0833333333333333
|
|
GO:BP
|
GO:0046461
|
neutral lipid catabolic process
|
0.000826776923982697
|
48
|
58
|
4
|
0.0689655172413793
|
0.0833333333333333
|
|
GO:BP
|
GO:0030099
|
myeloid cell differentiation
|
0.00121131281427967
|
428
|
16
|
5
|
0.3125
|
0.0116822429906542
|
|
GO:BP
|
GO:0071345
|
cellular response to cytokine stimulus
|
0.00121131281427967
|
1132
|
16
|
7
|
0.4375
|
0.00618374558303887
|
|
GO:BP
|
GO:0050896
|
response to stimulus
|
0.00177844231457435
|
9407
|
24
|
22
|
0.916666666666667
|
0.00233868395875412
|
|
GO:BP
|
GO:0051716
|
cellular response to stimulus
|
0.00270485220203751
|
7781
|
24
|
20
|
0.833333333333333
|
0.00257036370646446
|
|
GO:BP
|
GO:0046320
|
regulation of fatty acid oxidation
|
0.00405430731284855
|
33
|
48
|
3
|
0.0625
|
0.0909090909090909
|
|
GO:BP
|
GO:0046503
|
glycerolipid catabolic process
|
0.00406537490932311
|
74
|
58
|
4
|
0.0689655172413793
|
0.0540540540540541
|
|
GO:BP
|
GO:0071310
|
cellular response to organic substance
|
0.00796954453414816
|
2776
|
16
|
9
|
0.5625
|
0.00324207492795389
|
|
GO:BP
|
GO:0019433
|
triglyceride catabolic process
|
0.00994568031547941
|
38
|
58
|
3
|
0.0517241379310345
|
0.0789473684210526
|
|
GO:BP
|
GO:0031063
|
regulation of histone deacetylation
|
0.0145916809436386
|
32
|
80
|
3
|
0.0375
|
0.09375
|
|
GO:BP
|
GO:1903706
|
regulation of hemopoiesis
|
0.016204582438281
|
424
|
16
|
4
|
0.25
|
0.00943396226415094
|
|
GO:BP
|
GO:1903131
|
mononuclear cell differentiation
|
0.0168142563216538
|
430
|
16
|
4
|
0.25
|
0.00930232558139535
|
|
GO:BP
|
GO:0019221
|
cytokine-mediated signaling pathway
|
0.0180257661664976
|
810
|
16
|
5
|
0.3125
|
0.00617283950617284
|
|
GO:BP
|
GO:0035987
|
endodermal cell differentiation
|
0.0219686244702372
|
45
|
68
|
3
|
0.0441176470588235
|
0.0666666666666667
|
|
GO:BP
|
GO:0072001
|
renal system development
|
0.0249412630244053
|
302
|
65
|
6
|
0.0923076923076923
|
0.0198675496688742
|
|
GO:BP
|
GO:0030097
|
hemopoiesis
|
0.0278130329058941
|
928
|
16
|
5
|
0.3125
|
0.00538793103448276
|
|
GO:BP
|
GO:1902679
|
negative regulation of RNA biosynthetic process
|
0.0278130329058941
|
1341
|
17
|
6
|
0.352941176470588
|
0.00447427293064877
|
|
GO:BP
|
GO:0045637
|
regulation of myeloid cell differentiation
|
0.0278130329058941
|
263
|
14
|
3
|
0.214285714285714
|
0.0114068441064639
|
|
GO:BP
|
GO:0045892
|
negative regulation of transcription, DNA-templated
|
0.0278130329058941
|
1337
|
17
|
6
|
0.352941176470588
|
0.00448765893792072
|
|
GO:BP
|
GO:0010033
|
response to organic substance
|
0.0278130329058941
|
3412
|
16
|
9
|
0.5625
|
0.00263774912075029
|
|
GO:BP
|
GO:0044242
|
cellular lipid catabolic process
|
0.0278130329058941
|
232
|
58
|
5
|
0.0862068965517241
|
0.021551724137931
|
|
GO:BP
|
GO:0009952
|
anterior/posterior pattern specification
|
0.0278130329058941
|
211
|
64
|
5
|
0.078125
|
0.023696682464455
|
|
GO:BP
|
GO:0050994
|
regulation of lipid catabolic process
|
0.0278130329058941
|
60
|
58
|
3
|
0.0517241379310345
|
0.05
|
|
GO:BP
|
GO:1903507
|
negative regulation of nucleic acid-templated transcription
|
0.0278130329058941
|
1339
|
17
|
6
|
0.352941176470588
|
0.00448095593726662
|
|
GO:BP
|
GO:0002521
|
leukocyte differentiation
|
0.0296718535002897
|
550
|
16
|
4
|
0.25
|
0.00727272727272727
|
|
GO:BP
|
GO:0060562
|
epithelial tube morphogenesis
|
0.0296718535002897
|
329
|
65
|
6
|
0.0923076923076923
|
0.0182370820668693
|
|
GO:BP
|
GO:0006638
|
neutral lipid metabolic process
|
0.0296718535002897
|
142
|
58
|
4
|
0.0689655172413793
|
0.028169014084507
|
|
GO:BP
|
GO:0006639
|
acylglycerol metabolic process
|
0.0296718535002897
|
141
|
58
|
4
|
0.0689655172413793
|
0.0283687943262411
|
|
GO:BP
|
GO:0001706
|
endoderm formation
|
0.0296718535002897
|
54
|
68
|
3
|
0.0441176470588235
|
0.0555555555555556
|
|
GO:BP
|
GO:0048534
|
hematopoietic or lymphoid organ development
|
0.0296718535002897
|
966
|
16
|
5
|
0.3125
|
0.005175983436853
|
|
GO:BP
|
GO:0050789
|
regulation of biological process
|
0.0296718535002897
|
12091
|
23
|
22
|
0.956521739130435
|
0.00181953519146473
|
|
GO:BP
|
GO:0090311
|
regulation of protein deacetylation
|
0.0316156719309738
|
48
|
80
|
3
|
0.0375
|
0.0625
|
|
GO:BP
|
GO:0003002
|
regionalization
|
0.0321012877856284
|
338
|
65
|
6
|
0.0923076923076923
|
0.0177514792899408
|
|
GO:BP
|
GO:0001655
|
urogenital system development
|
0.0321012877856284
|
337
|
65
|
6
|
0.0923076923076923
|
0.0178041543026706
|
|
GO:BP
|
GO:0051253
|
negative regulation of RNA metabolic process
|
0.0342442967493602
|
1445
|
17
|
6
|
0.352941176470588
|
0.0041522491349481
|
|
GO:BP
|
GO:0002520
|
immune system development
|
0.0342442967493602
|
1020
|
16
|
5
|
0.3125
|
0.00490196078431373
|
|
GO:BP
|
GO:0035690
|
cellular response to drug
|
0.037748479072111
|
70
|
61
|
3
|
0.0491803278688525
|
0.0428571428571429
|
|
GO:BP
|
GO:1902105
|
regulation of leukocyte differentiation
|
0.0405955801645813
|
288
|
16
|
3
|
0.1875
|
0.0104166666666667
|
|
GO:BP
|
GO:0045934
|
negative regulation of nucleobase-containing compound metabolic process
|
0.0424470313805183
|
1548
|
17
|
6
|
0.352941176470588
|
0.00387596899224806
|
|
GO:BP
|
GO:0010817
|
regulation of hormone levels
|
0.0485497885599161
|
536
|
80
|
8
|
0.1
|
0.0149253731343284
|
|
GO:CC
|
GO:0005634
|
nucleus
|
0.0150235197482886
|
7592
|
17
|
15
|
0.882352941176471
|
0.00197576396206533
|
|
GO:CC
|
GO:0043231
|
intracellular membrane-bounded organelle
|
0.0194967967625381
|
11296
|
17
|
17
|
1
|
0.00150495750708215
|
|
GO:MF
|
GO:0008270
|
zinc ion binding
|
0.000329731526684848
|
833
|
6
|
5
|
0.833333333333333
|
0.00600240096038415
|
|
GO:MF
|
GO:0046914
|
transition metal ion binding
|
0.000688894429514453
|
1111
|
6
|
5
|
0.833333333333333
|
0.0045004500450045
|
|
GO:MF
|
GO:0001227
|
DNA-binding transcription repressor activity, RNA polymerase II-specific
|
0.00864260074505329
|
312
|
16
|
4
|
0.25
|
0.0128205128205128
|
|
GO:MF
|
GO:0001217
|
DNA-binding transcription repressor activity
|
0.00864260074505329
|
314
|
16
|
4
|
0.25
|
0.0127388535031847
|
|
GO:MF
|
GO:0001216
|
DNA-binding transcription activator activity
|
0.0133891865291908
|
455
|
14
|
4
|
0.285714285714286
|
0.00879120879120879
|
|
GO:MF
|
GO:0001228
|
DNA-binding transcription activator activity, RNA polymerase II-specific
|
0.0133891865291908
|
451
|
14
|
4
|
0.285714285714286
|
0.00886917960088692
|
|
GO:MF
|
GO:0000987
|
cis-regulatory region sequence-specific DNA binding
|
0.0177741339665776
|
1209
|
78
|
14
|
0.179487179487179
|
0.0115798180314309
|
|
GO:MF
|
GO:0008144
|
drug binding
|
0.020572189783117
|
65
|
48
|
3
|
0.0625
|
0.0461538461538462
|
|
GO:MF
|
GO:0043167
|
ion binding
|
0.020572189783117
|
6057
|
22
|
15
|
0.681818181818182
|
0.00247647350173353
|
|
GO:MF
|
GO:0000978
|
RNA polymerase II cis-regulatory region sequence-specific DNA binding
|
0.0332874147538582
|
1190
|
78
|
13
|
0.166666666666667
|
0.0109243697478992
|
|
GO:MF
|
GO:0000976
|
transcription regulatory region sequence-specific DNA binding
|
0.0380741590294101
|
1507
|
78
|
14
|
0.179487179487179
|
0.0092899800928998
|
|
GO:MF
|
GO:0046872
|
metal ion binding
|
0.0380741590294101
|
4260
|
4
|
4
|
1
|
0.000938967136150235
|
|
GO:MF
|
GO:0043565
|
sequence-specific DNA binding
|
0.0380741590294101
|
1673
|
78
|
15
|
0.192307692307692
|
0.00896592946802152
|
|
GO:MF
|
GO:0043169
|
cation binding
|
0.0380741590294101
|
4351
|
4
|
4
|
1
|
0.000919328889910365
|
|
GO:MF
|
GO:0005515
|
protein binding
|
0.0380741590294101
|
14767
|
24
|
24
|
1
|
0.00162524547978601
|
|
GO:MF
|
GO:0003690
|
double-stranded DNA binding
|
0.0380741590294101
|
1664
|
78
|
15
|
0.192307692307692
|
0.00901442307692308
|
|
GO:MF
|
GO:0001067
|
regulatory region nucleic acid binding
|
0.0380741590294101
|
1509
|
78
|
14
|
0.179487179487179
|
0.00927766732935719
|
|
GO:MF
|
GO:1990837
|
sequence-specific double-stranded DNA binding
|
0.0380741590294101
|
1570
|
78
|
15
|
0.192307692307692
|
0.00955414012738853
|
|
GO:MF
|
GO:0005319
|
lipid transporter activity
|
0.0413076695519801
|
167
|
76
|
4
|
0.0526315789473684
|
0.0239520958083832
|
|
GO:MF
|
GO:0000981
|
DNA-binding transcription factor activity, RNA polymerase II-specific
|
0.0413076695519801
|
1375
|
16
|
5
|
0.3125
|
0.00363636363636364
|
|
GO:MF
|
GO:0000977
|
RNA polymerase II transcription regulatory region sequence-specific DNA binding
|
0.0426183153477176
|
1408
|
16
|
5
|
0.3125
|
0.00355113636363636
|
|
GO:MF
|
GO:0003700
|
DNA-binding transcription factor activity
|
0.0449282694395386
|
1441
|
16
|
5
|
0.3125
|
0.00346981263011797
|
|
KEGG
|
KEGG:04978
|
Mineral absorption
|
1.70378421775668e-10
|
59
|
22
|
8
|
0.363636363636364
|
0.135593220338983
|
|
REAC
|
REAC:R-HSA-5661231
|
Metallothioneins bind metals
|
3.6618276789786e-18
|
11
|
22
|
8
|
0.363636363636364
|
0.727272727272727
|
|
REAC
|
REAC:R-HSA-5660526
|
Response to metal ions
|
3.32046511749937e-17
|
14
|
22
|
8
|
0.363636363636364
|
0.571428571428571
|
|
REAC
|
REAC:R-HSA-8953897
|
Cellular responses to external stimuli
|
1.04030067950968e-06
|
560
|
15
|
9
|
0.6
|
0.0160714285714286
|
|
REAC
|
REAC:R-HSA-6785807
|
Interleukin-4 and Interleukin-13 signaling
|
0.00121882626102798
|
110
|
16
|
4
|
0.25
|
0.0363636363636364
|
|
REAC
|
REAC:R-HSA-9006931
|
Signaling by Nuclear Receptors
|
0.0121132362214113
|
255
|
14
|
4
|
0.285714285714286
|
0.0156862745098039
|
|
TF
|
TF:M00650_1
|
Factor: MTF-1; motif: TBTGCACHCGGCCC; match class: 1
|
2.98565906582625e-08
|
24
|
15
|
5
|
0.333333333333333
|
0.208333333333333
|
|
TF
|
TF:M10163
|
Factor: ZNF708; motif: GNNNAANAARNAGGYACAGC
|
0.00120532816986091
|
219
|
15
|
5
|
0.333333333333333
|
0.0228310502283105
|
|
TF
|
TF:M08890_1
|
Factor: MYB; motif: NNAACTGN; match class: 1
|
0.00120532816986091
|
63
|
6
|
3
|
0.5
|
0.0476190476190476
|
|
TF
|
TF:M01201_1
|
Factor: AR; motif: GGNACRNNRTGTWCT; match class: 1
|
0.00179769914321989
|
2129
|
8
|
7
|
0.875
|
0.00328792860497886
|
|
TF
|
TF:M00481_1
|
Factor: AR; motif: GGTACANNRTGTTCT; match class: 1
|
0.00241445926222845
|
2295
|
8
|
7
|
0.875
|
0.00305010893246187
|
|
TF
|
TF:M00650
|
Factor: MTF-1; motif: TBTGCACHCGGCCC
|
0.00284208719848723
|
816
|
4
|
4
|
1
|
0.00490196078431373
|
|
TF
|
TF:M07341_1
|
Factor: TORC2; motif: TGGGCTKKD; match class: 1
|
0.00291715067258439
|
884
|
7
|
5
|
0.714285714285714
|
0.00565610859728507
|
|
TF
|
TF:M08890
|
Factor: MYB; motif: NNAACTGN
|
0.0047408770243201
|
1355
|
22
|
9
|
0.409090909090909
|
0.00664206642066421
|
|
TF
|
TF:M02088
|
Factor: E2A; motif: NRMCASCTGCNNN
|
0.0047408770243201
|
2871
|
10
|
8
|
0.8
|
0.00278648554510623
|
|
TF
|
TF:M04903
|
Factor: HNF-4alpha; motif: AGTCCAAR
|
0.00613344301329249
|
6987
|
17
|
15
|
0.882352941176471
|
0.0021468441391155
|
|
TF
|
TF:M10042_1
|
Factor: PR; motif: RGNACATTYTGTNCTN; match class: 1
|
0.0086230514807124
|
998
|
8
|
5
|
0.625
|
0.00501002004008016
|
|
TF
|
TF:M10042
|
Factor: PR; motif: RGNACATTYTGTNCTN
|
0.00899256080066435
|
3203
|
8
|
7
|
0.875
|
0.00218545113955667
|
|
TF
|
TF:M01119_1
|
Factor: Kaiso; motif: NTCCTGCNAN; match class: 1
|
0.00899256080066435
|
542
|
22
|
6
|
0.272727272727273
|
0.011070110701107
|
|
TF
|
TF:M09941_1
|
Factor: GR; motif: RGNACANMNTGTNCY; match class: 1
|
0.0112526295036676
|
2046
|
8
|
6
|
0.75
|
0.00293255131964809
|
|
TF
|
TF:M04453_1
|
Factor: AR; motif: RGGWACAYNGTGTWCYN; match class: 1
|
0.0234116102807557
|
3794
|
8
|
7
|
0.875
|
0.0018450184501845
|
|
TF
|
TF:M09725
|
Factor: DREF; motif: CTYYCWCTTCCY
|
0.0234116102807557
|
7519
|
16
|
14
|
0.875
|
0.00186194972735736
|
|
TF
|
TF:M09813_1
|
Factor: MYB; motif: NNCAACTGNN; match class: 1
|
0.025959639578879
|
979
|
6
|
4
|
0.666666666666667
|
0.00408580183861083
|
|
TF
|
TF:M10085
|
Factor: RBPJK; motif: NSNSTGGGAAN
|
0.025959639578879
|
3436
|
11
|
8
|
0.727272727272727
|
0.00232828870779977
|
|
TF
|
TF:M11846_1
|
Factor: GR; motif: RGWACATWAYGTWCY; match class: 1
|
0.0270216309980286
|
3998
|
8
|
7
|
0.875
|
0.00175087543771886
|
|
TF
|
TF:M07340_1
|
Factor: TEF-1; motif: ACATTCCWSNN; match class: 1
|
0.0305380941792061
|
468
|
21
|
5
|
0.238095238095238
|
0.0106837606837607
|
|
TF
|
TF:M04715
|
Factor: Oct-2; motif: ATTTGCA
|
0.0330912008974043
|
6381
|
28
|
19
|
0.678571428571429
|
0.00297758971947971
|
|
TF
|
TF:M09625_1
|
Factor: GR; motif: RGNACANKNTGTNCY; match class: 1
|
0.0330912008974043
|
4205
|
8
|
7
|
0.875
|
0.00166468489892985
|
|
TF
|
TF:M11849_1
|
Factor: MR; motif: NGNACRNNNYGTNCN; match class: 1
|
0.0348511930558879
|
4264
|
8
|
7
|
0.875
|
0.00164165103189493
|
|
TF
|
TF:M12280_1
|
Factor: MTF-1; motif: NTTTTGCACACGGCNNN; match class: 1
|
0.0352771251609803
|
1485
|
5
|
4
|
0.8
|
0.00269360269360269
|
|
TF
|
TF:M11849
|
Factor: MR; motif: NGNACRNNNYGTNCN
|
0.0353619676732459
|
4324
|
8
|
7
|
0.875
|
0.00161887141535615
|
|
TF
|
TF:M04750_1
|
Factor: GR; motif: RGRACATTNTGTYC; match class: 1
|
0.0426195366997842
|
1704
|
8
|
5
|
0.625
|
0.00293427230046948
|
|
TF
|
TF:M08402
|
Factor: POU2F1:PEA3; motif: ACCGGATATGCAN
|
0.0426195366997842
|
8519
|
10
|
10
|
1
|
0.00117384669562155
|
|
TF
|
TF:M00279_1
|
Factor: MIF-1; motif: NNGTTGCWWGGYAACNGS; match class: 1
|
0.0426195366997842
|
5341
|
19
|
13
|
0.684210526315789
|
0.00243400112338513
|
|
TF
|
TF:M04903_1
|
Factor: HNF-4alpha; motif: AGTCCAAR; match class: 1
|
0.0426195366997842
|
1534
|
23
|
8
|
0.347826086956522
|
0.00521512385919166
|
|
TF
|
TF:M04619
|
Factor: MTF-1; motif: CCGNGTGCAV
|
0.0426195366997842
|
1167
|
3
|
3
|
1
|
0.0025706940874036
|
|
TF
|
TF:M00146
|
Factor: HSF1; motif: AGAANRTTCN
|
0.0448467669982537
|
2678
|
6
|
5
|
0.833333333333333
|
0.00186706497386109
|
|
TF
|
TF:M04218
|
Factor: MAFK; motif: NTGCTGANTCAGCRN
|
0.0455794391593621
|
261
|
10
|
3
|
0.3
|
0.0114942528735632
|
|
TF
|
TF:M11344_1
|
Factor: MafF; motif: NTGCTGASTCAGCAN; match class: 1
|
0.0478193634966985
|
268
|
10
|
3
|
0.3
|
0.0111940298507463
|
|
TF
|
TF:M00280
|
Factor: RFX1; motif: NNGTNRCNWRGYAACNN
|
0.0482255324442696
|
6402
|
25
|
17
|
0.68
|
0.00265542018119338
|
|
TF
|
TF:M00447_1
|
Factor: AR; motif: AGWACATNWTGTTCT; match class: 1
|
0.0496050779122406
|
854
|
4
|
3
|
0.75
|
0.00351288056206089
|
|
TF
|
TF:M11344
|
Factor: MafF; motif: NTGCTGASTCAGCAN
|
0.0496050779122406
|
278
|
10
|
3
|
0.3
|
0.0107913669064748
|
|
WP
|
WP:WP3529
|
Zinc homeostasis
|
6.54904383001724e-12
|
37
|
22
|
8
|
0.363636363636364
|
0.216216216216216
|
|
WP
|
WP:WP3286
|
Copper homeostasis
|
8.58048236034612e-11
|
54
|
22
|
8
|
0.363636363636364
|
0.148148148148148
|
|
WP
|
WP:WP3584
|
MECP2 and Associated Rett Syndrome
|
0.01955709349689
|
72
|
16
|
3
|
0.1875
|
0.0416666666666667
|
|
WP
|
WP:WP710
|
DNA Damage Response (only ATM dependent)
|
0.0399875775597372
|
114
|
16
|
3
|
0.1875
|
0.0263157894736842
|