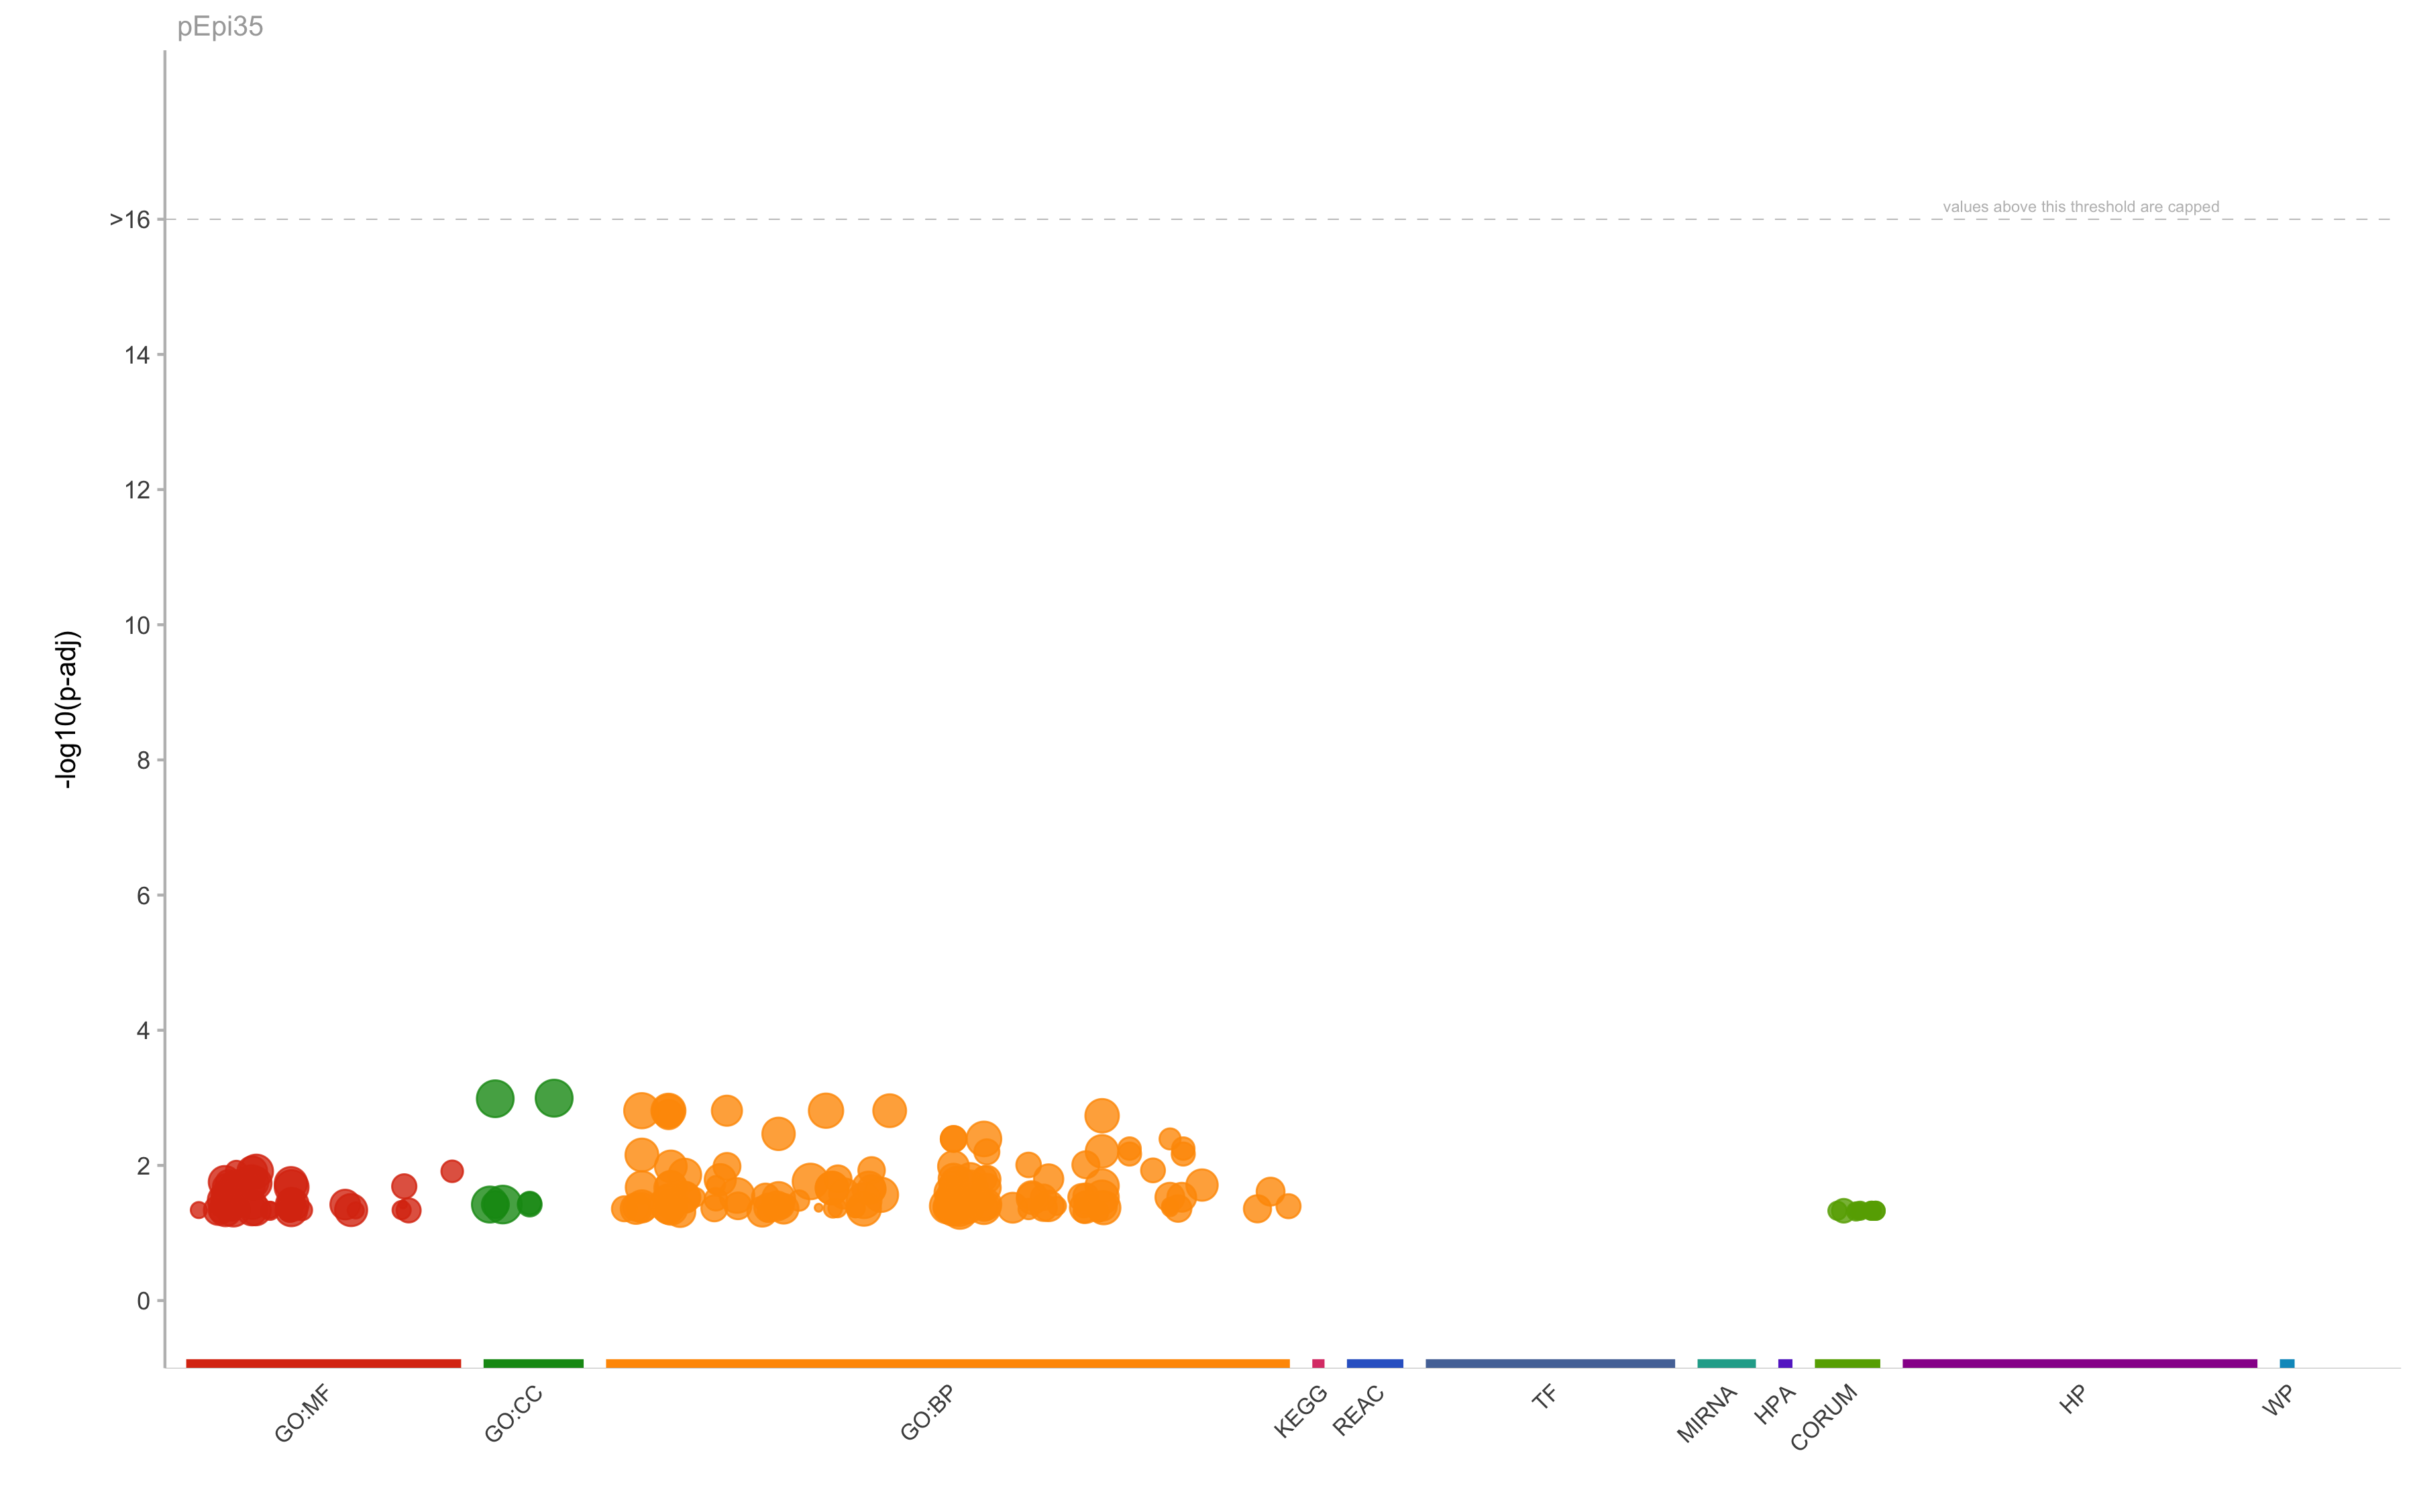
|
GO:BP
|
GO:0006816
|
calcium ion transport
|
0.00155097047163632
|
436
|
42
|
8
|
0.19047619047619
|
0.018348623853211
|
|
GO:BP
|
GO:0006812
|
cation transport
|
0.00155097047163632
|
1197
|
46
|
13
|
0.282608695652174
|
0.0108604845446951
|
|
GO:BP
|
GO:0015698
|
inorganic anion transport
|
0.00155097047163632
|
169
|
46
|
6
|
0.130434782608696
|
0.0355029585798817
|
|
GO:BP
|
GO:0044057
|
regulation of system process
|
0.00155097047163632
|
623
|
49
|
10
|
0.204081632653061
|
0.0160513643659711
|
|
GO:BP
|
GO:0003008
|
system process
|
0.00155097047163632
|
2293
|
49
|
19
|
0.387755102040816
|
0.00828608809419974
|
|
GO:BP
|
GO:0034220
|
ion transmembrane transport
|
0.00155097047163632
|
1397
|
46
|
14
|
0.304347826086957
|
0.0100214745884037
|
|
GO:BP
|
GO:0006821
|
chloride transport
|
0.00177177410072372
|
109
|
46
|
5
|
0.108695652173913
|
0.0458715596330275
|
|
GO:BP
|
GO:0098660
|
inorganic ion transmembrane transport
|
0.00184221366216056
|
883
|
46
|
11
|
0.239130434782609
|
0.0124575311438279
|
|
GO:BP
|
GO:0030001
|
metal ion transport
|
0.00341432472254844
|
514
|
42
|
8
|
0.19047619047619
|
0.0155642023346304
|
|
GO:BP
|
GO:0050926
|
regulation of positive chemotaxis
|
0.00405617844430549
|
27
|
42
|
3
|
0.0714285714285714
|
0.111111111111111
|
|
GO:BP
|
GO:0055085
|
transmembrane transport
|
0.00405617844430549
|
1635
|
46
|
14
|
0.304347826086957
|
0.00856269113149847
|
|
GO:BP
|
GO:0050927
|
positive regulation of positive chemotaxis
|
0.00405617844430549
|
26
|
42
|
3
|
0.0714285714285714
|
0.115384615384615
|
|
GO:BP
|
GO:0098656
|
anion transmembrane transport
|
0.00619353132247971
|
550
|
46
|
8
|
0.173913043478261
|
0.0145454545454545
|
|
GO:BP
|
GO:0003013
|
circulatory system process
|
0.00701389570956837
|
637
|
42
|
8
|
0.19047619047619
|
0.0125588697017268
|
|
GO:BP
|
GO:0090279
|
regulation of calcium ion import
|
0.00977816068589924
|
43
|
42
|
3
|
0.0714285714285714
|
0.0697674418604651
|
|
GO:BP
|
GO:0050920
|
regulation of chemotaxis
|
0.010342153854942
|
226
|
42
|
5
|
0.119047619047619
|
0.0221238938053097
|
|
GO:BP
|
GO:0015701
|
bicarbonate transport
|
0.010342153854942
|
42
|
46
|
3
|
0.0652173913043478
|
0.0714285714285714
|
|
GO:BP
|
GO:0006936
|
muscle contraction
|
0.010342153854942
|
364
|
41
|
6
|
0.146341463414634
|
0.0164835164835165
|
|
GO:BP
|
GO:0008015
|
blood circulation
|
0.0138674245011871
|
553
|
42
|
7
|
0.166666666666667
|
0.0126582278481013
|
|
GO:BP
|
GO:0050921
|
positive regulation of chemotaxis
|
0.015675884335652
|
141
|
42
|
4
|
0.0952380952380952
|
0.0283687943262411
|
|
GO:BP
|
GO:0051924
|
regulation of calcium ion transport
|
0.015675884335652
|
259
|
42
|
5
|
0.119047619047619
|
0.0193050193050193
|
|
GO:BP
|
GO:0071675
|
regulation of mononuclear cell migration
|
0.0158708072191678
|
113
|
53
|
4
|
0.0754716981132075
|
0.0353982300884956
|
|
GO:BP
|
GO:0010959
|
regulation of metal ion transport
|
0.0162412276780519
|
268
|
42
|
5
|
0.119047619047619
|
0.0186567164179104
|
|
GO:BP
|
GO:0032879
|
regulation of localization
|
0.0172760248170221
|
2872
|
42
|
16
|
0.380952380952381
|
0.00557103064066852
|
|
GO:BP
|
GO:1903522
|
regulation of blood circulation
|
0.0195358295440492
|
301
|
40
|
5
|
0.125
|
0.0166112956810631
|
|
GO:BP
|
GO:0051179
|
localization
|
0.0195358295440492
|
6901
|
42
|
27
|
0.642857142857143
|
0.00391247645268802
|
|
GO:BP
|
GO:0050918
|
positive chemotaxis
|
0.0195358295440492
|
68
|
42
|
3
|
0.0714285714285714
|
0.0441176470588235
|
|
GO:BP
|
GO:0098662
|
inorganic cation transmembrane transport
|
0.020126724682546
|
794
|
34
|
7
|
0.205882352941176
|
0.00881612090680101
|
|
GO:BP
|
GO:0006937
|
regulation of muscle contraction
|
0.020126724682546
|
170
|
41
|
4
|
0.0975609756097561
|
0.0235294117647059
|
|
GO:BP
|
GO:0003012
|
muscle system process
|
0.0211506221823958
|
471
|
41
|
6
|
0.146341463414634
|
0.0127388535031847
|
|
GO:BP
|
GO:0042330
|
taxis
|
0.0216515007430146
|
656
|
42
|
7
|
0.166666666666667
|
0.0106707317073171
|
|
GO:BP
|
GO:0034765
|
regulation of ion transmembrane transport
|
0.0216515007430146
|
583
|
34
|
6
|
0.176470588235294
|
0.0102915951972556
|
|
GO:BP
|
GO:0034762
|
regulation of transmembrane transport
|
0.0216515007430146
|
588
|
34
|
6
|
0.176470588235294
|
0.0102040816326531
|
|
GO:BP
|
GO:0006935
|
chemotaxis
|
0.0216515007430146
|
653
|
42
|
7
|
0.166666666666667
|
0.0107197549770291
|
|
GO:BP
|
GO:2000401
|
regulation of lymphocyte migration
|
0.0244332130698698
|
63
|
53
|
3
|
0.0566037735849057
|
0.0476190476190476
|
|
GO:BP
|
GO:0050801
|
ion homeostasis
|
0.0252855569337246
|
808
|
46
|
8
|
0.173913043478261
|
0.0099009900990099
|
|
GO:BP
|
GO:0035725
|
sodium ion transmembrane transport
|
0.026043571995168
|
171
|
46
|
4
|
0.0869565217391304
|
0.0233918128654971
|
|
GO:BP
|
GO:0043269
|
regulation of ion transport
|
0.0272119300570335
|
1379
|
42
|
10
|
0.238095238095238
|
0.00725163161711385
|
|
GO:BP
|
GO:0070509
|
calcium ion import
|
0.027876463502601
|
86
|
42
|
3
|
0.0714285714285714
|
0.0348837209302326
|
|
GO:BP
|
GO:0016477
|
cell migration
|
0.027876463502601
|
1649
|
42
|
11
|
0.261904761904762
|
0.00667070952092177
|
|
GO:BP
|
GO:0050807
|
regulation of synapse organization
|
0.0295964023980266
|
212
|
19
|
3
|
0.157894736842105
|
0.0141509433962264
|
|
GO:BP
|
GO:0098655
|
cation transmembrane transport
|
0.0295964023980266
|
914
|
34
|
7
|
0.205882352941176
|
0.00765864332603939
|
|
GO:BP
|
GO:1902476
|
chloride transmembrane transport
|
0.0295964023980266
|
95
|
40
|
3
|
0.075
|
0.0315789473684211
|
|
GO:BP
|
GO:0007626
|
locomotory behavior
|
0.0295964023980266
|
189
|
46
|
4
|
0.0869565217391304
|
0.0211640211640212
|
|
GO:BP
|
GO:0008016
|
regulation of heart contraction
|
0.0295964023980266
|
254
|
34
|
4
|
0.117647058823529
|
0.015748031496063
|
|
GO:BP
|
GO:0070588
|
calcium ion transmembrane transport
|
0.0306238343659416
|
320
|
28
|
4
|
0.142857142857143
|
0.0125
|
|
GO:BP
|
GO:0030003
|
cellular cation homeostasis
|
0.0309414690257801
|
673
|
46
|
7
|
0.152173913043478
|
0.0104011887072808
|
|
GO:BP
|
GO:0050803
|
regulation of synapse structure or activity
|
0.0323454166555834
|
223
|
19
|
3
|
0.157894736842105
|
0.0134529147982063
|
|
GO:BP
|
GO:0040011
|
locomotion
|
0.0331427447942783
|
2028
|
42
|
12
|
0.285714285714286
|
0.00591715976331361
|
|
GO:BP
|
GO:0006873
|
cellular ion homeostasis
|
0.0331427447942783
|
687
|
46
|
7
|
0.152173913043478
|
0.0101892285298399
|
|
GO:BP
|
GO:0006810
|
transport
|
0.0375884838683117
|
5224
|
46
|
23
|
0.5
|
0.00440275650842266
|
|
GO:BP
|
GO:0006939
|
smooth muscle contraction
|
0.0375884838683117
|
110
|
41
|
3
|
0.0731707317073171
|
0.0272727272727273
|
|
GO:BP
|
GO:0060047
|
heart contraction
|
0.0376778238841827
|
288
|
34
|
4
|
0.117647058823529
|
0.0138888888888889
|
|
GO:BP
|
GO:0048870
|
cell motility
|
0.0398406238934338
|
1828
|
42
|
11
|
0.261904761904762
|
0.00601750547045952
|
|
GO:BP
|
GO:0098661
|
inorganic anion transmembrane transport
|
0.0398406238934338
|
118
|
40
|
3
|
0.075
|
0.0254237288135593
|
|
GO:BP
|
GO:0071674
|
mononuclear cell migration
|
0.0398406238934338
|
191
|
53
|
4
|
0.0754716981132075
|
0.0209424083769634
|
|
GO:BP
|
GO:0003015
|
heart process
|
0.0398406238934338
|
298
|
34
|
4
|
0.117647058823529
|
0.0134228187919463
|
|
GO:BP
|
GO:0051674
|
localization of cell
|
0.0398406238934338
|
1828
|
42
|
11
|
0.261904761904762
|
0.00601750547045952
|
|
GO:BP
|
GO:0051049
|
regulation of transport
|
0.0398406238934338
|
1809
|
42
|
11
|
0.261904761904762
|
0.00608070757324489
|
|
GO:BP
|
GO:0055080
|
cation homeostasis
|
0.0418968386640017
|
750
|
46
|
7
|
0.152173913043478
|
0.00933333333333333
|
|
GO:BP
|
GO:0090257
|
regulation of muscle system process
|
0.0418968386640017
|
257
|
41
|
4
|
0.0975609756097561
|
0.0155642023346304
|
|
GO:BP
|
GO:0061337
|
cardiac conduction
|
0.0422555441140425
|
150
|
34
|
3
|
0.0882352941176471
|
0.02
|
|
GO:BP
|
GO:0051234
|
establishment of localization
|
0.0422555441140425
|
5372
|
46
|
23
|
0.5
|
0.00428145941921072
|
|
GO:BP
|
GO:0003014
|
renal system process
|
0.0422555441140425
|
126
|
41
|
3
|
0.0731707317073171
|
0.0238095238095238
|
|
GO:BP
|
GO:0098771
|
inorganic ion homeostasis
|
0.0422555441140425
|
761
|
46
|
7
|
0.152173913043478
|
0.00919842312746386
|
|
GO:BP
|
GO:0006814
|
sodium ion transport
|
0.0432232025352228
|
241
|
46
|
4
|
0.0869565217391304
|
0.016597510373444
|
|
GO:BP
|
GO:0002685
|
regulation of leukocyte migration
|
0.0435211429811587
|
211
|
53
|
4
|
0.0754716981132075
|
0.018957345971564
|
|
GO:BP
|
GO:0030534
|
adult behavior
|
0.0438566197560389
|
131
|
42
|
3
|
0.0714285714285714
|
0.0229007633587786
|
|
GO:BP
|
GO:0040012
|
regulation of locomotion
|
0.0438566197560389
|
1104
|
42
|
8
|
0.19047619047619
|
0.0072463768115942
|
|
GO:BP
|
GO:0006959
|
humoral immune response
|
0.0438566197560389
|
384
|
30
|
4
|
0.133333333333333
|
0.0104166666666667
|
|
GO:BP
|
GO:0050900
|
leukocyte migration
|
0.0447531393908989
|
511
|
53
|
6
|
0.113207547169811
|
0.0117416829745597
|
|
GO:BP
|
GO:0051270
|
regulation of cellular component movement
|
0.0486522342866267
|
1141
|
42
|
8
|
0.19047619047619
|
0.007011393514461
|
|
GO:CC
|
GO:0071944
|
cell periphery
|
0.00101246629368815
|
6169
|
50
|
32
|
0.64
|
0.00518722645485492
|
|
GO:CC
|
GO:0005886
|
plasma membrane
|
0.00103257624629024
|
5681
|
50
|
30
|
0.6
|
0.00528076042950185
|
|
GO:CC
|
GO:0016020
|
membrane
|
0.0379437556482839
|
9838
|
50
|
37
|
0.74
|
0.00376092701768652
|
|
GO:CC
|
GO:0005615
|
extracellular space
|
0.0379437556482839
|
3594
|
4
|
4
|
1
|
0.00111296605453534
|
|
GO:MF
|
GO:0015103
|
inorganic anion transmembrane transporter activity
|
0.0122234227643947
|
142
|
15
|
3
|
0.2
|
0.0211267605633803
|
|
GO:MF
|
GO:0015318
|
inorganic molecular entity transmembrane transporter activity
|
0.0122234227643947
|
831
|
46
|
9
|
0.195652173913043
|
0.0108303249097473
|
|
GO:MF
|
GO:0005216
|
ion channel activity
|
0.0176261990400587
|
435
|
41
|
6
|
0.146341463414634
|
0.0137931034482759
|
|
GO:MF
|
GO:0015075
|
ion transmembrane transporter activity
|
0.0176261990400587
|
956
|
46
|
9
|
0.195652173913043
|
0.00941422594142259
|
|
GO:MF
|
GO:0022803
|
passive transmembrane transporter activity
|
0.0183371600550699
|
485
|
41
|
6
|
0.146341463414634
|
0.0123711340206186
|
|
GO:MF
|
GO:0015267
|
channel activity
|
0.0183371600550699
|
484
|
41
|
6
|
0.146341463414634
|
0.012396694214876
|
|
GO:MF
|
GO:0008509
|
anion transmembrane transporter activity
|
0.020441211946784
|
464
|
46
|
6
|
0.130434782608696
|
0.0129310344827586
|
|
GO:MF
|
GO:0022857
|
transmembrane transporter activity
|
0.0209069149853661
|
1075
|
46
|
9
|
0.195652173913043
|
0.00837209302325581
|
|
GO:MF
|
GO:0005215
|
transporter activity
|
0.033162714781272
|
1185
|
46
|
9
|
0.195652173913043
|
0.00759493670886076
|
|
GO:MF
|
GO:0022890
|
inorganic cation transmembrane transporter activity
|
0.0379464189648347
|
591
|
46
|
6
|
0.130434782608696
|
0.0101522842639594
|
|
GO:MF
|
GO:0044325
|
ion channel binding
|
0.0379464189648347
|
135
|
40
|
3
|
0.075
|
0.0222222222222222
|
|
GO:MF
|
GO:0008324
|
cation transmembrane transporter activity
|
0.0457735384010176
|
639
|
46
|
6
|
0.130434782608696
|
0.00938967136150235
|
|
GO:MF
|
GO:0046873
|
metal ion transmembrane transporter activity
|
0.0457735384010176
|
435
|
46
|
5
|
0.108695652173913
|
0.0114942528735632
|
|
GO:MF
|
GO:0005261
|
cation channel activity
|
0.0463292343699831
|
340
|
41
|
4
|
0.0975609756097561
|
0.0117647058823529
|
|
GO:MF
|
GO:0015081
|
sodium ion transmembrane transporter activity
|
0.0463292343699831
|
151
|
46
|
3
|
0.0652173913043478
|
0.0198675496688742
|
|
GO:MF
|
GO:0015293
|
symporter activity
|
0.0463292343699831
|
143
|
46
|
3
|
0.0652173913043478
|
0.020979020979021
|
|
GO:MF
|
GO:0022836
|
gated channel activity
|
0.0463292343699831
|
341
|
41
|
4
|
0.0975609756097561
|
0.0117302052785924
|