|
GO:BP
|
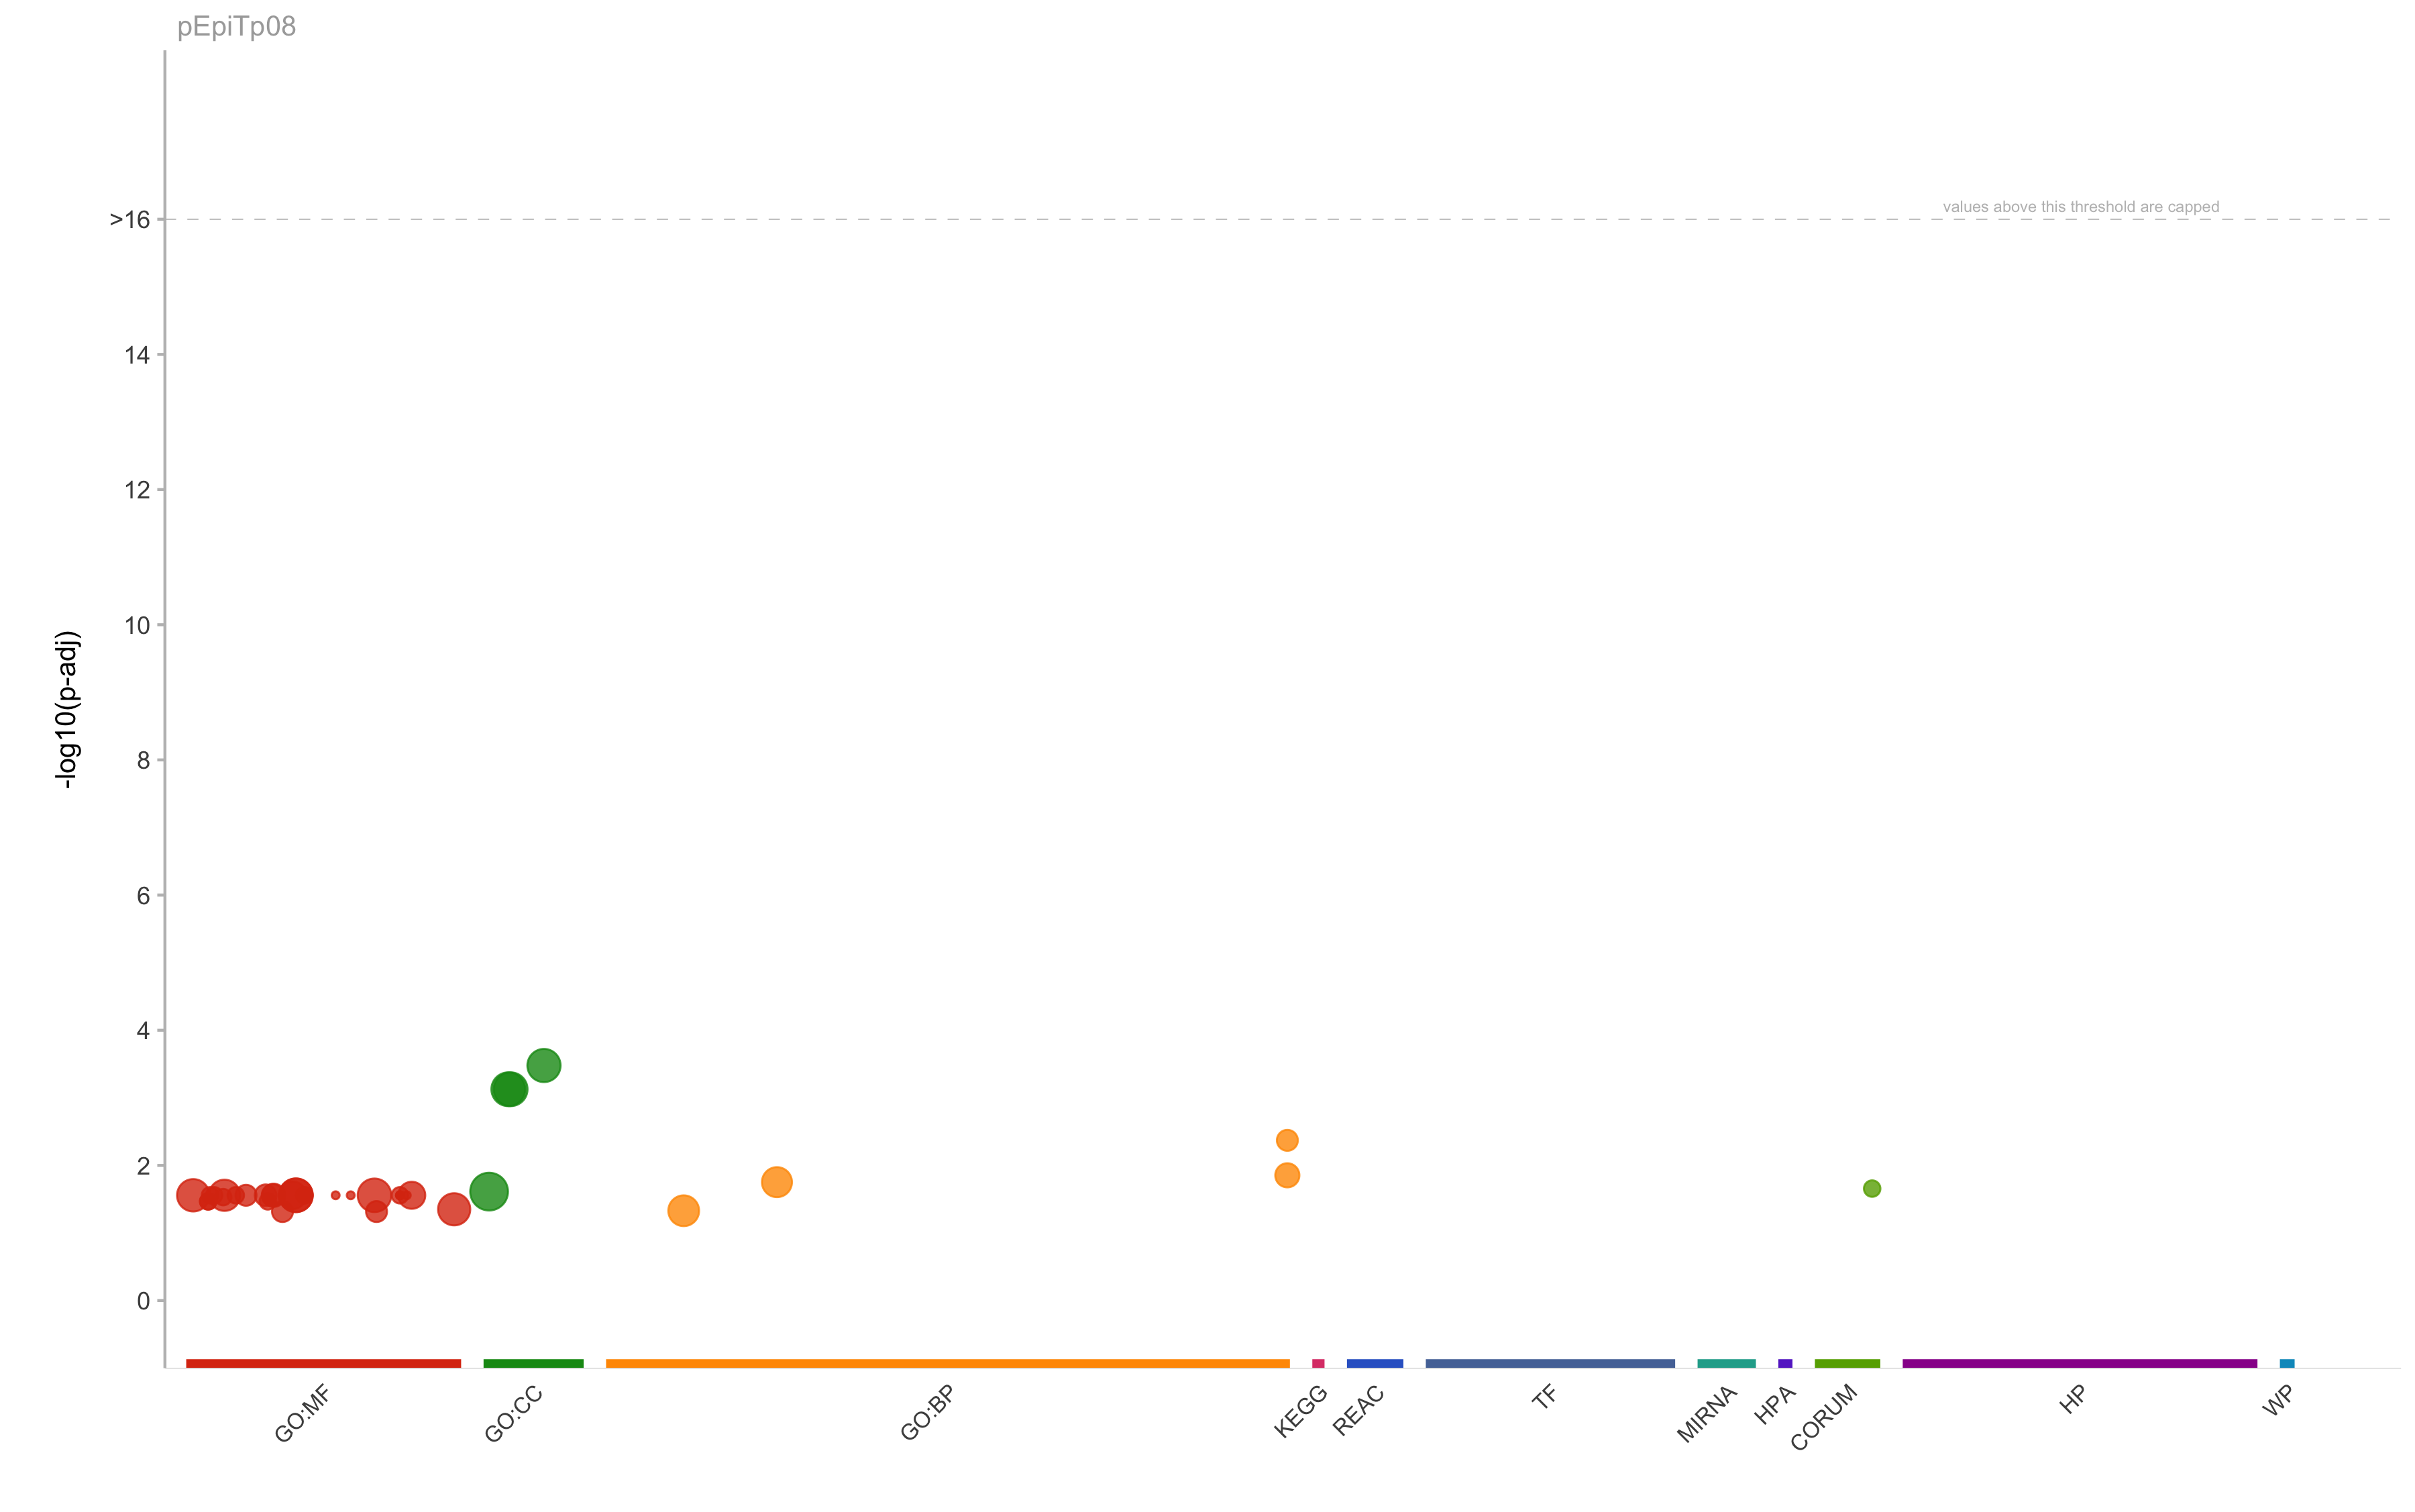
GO:0022600
|
digestive system process
|
0.0176935103237252
|
102
|
33
|
4
|
0.121212121212121
|
0.0392156862745098
|
|
GO:BP
|
GO:0007586
|
digestion
|
0.046867707221129
|
141
|
33
|
4
|
0.121212121212121
|
0.0283687943262411
|
|
GO:CC
|
GO:0062023
|
collagen-containing extracellular matrix
|
0.00033247840704336
|
421
|
28
|
7
|
0.25
|
0.0166270783847981
|
|
GO:CC
|
GO:0031012
|
extracellular matrix
|
0.000746492083225047
|
562
|
28
|
7
|
0.25
|
0.0124555160142349
|
|
GO:CC
|
GO:0030312
|
external encapsulating structure
|
0.000746492083225047
|
563
|
28
|
7
|
0.25
|
0.0124333925399645
|
|
GO:CC
|
GO:0005576
|
extracellular region
|
0.0244101467700451
|
4567
|
59
|
26
|
0.440677966101695
|
0.00569301510838625
|
|
GO:MF
|
GO:0048018
|
receptor ligand activity
|
0.0276750080993787
|
494
|
47
|
6
|
0.127659574468085
|
0.0121457489878543
|
|
GO:MF
|
GO:0001664
|
G protein-coupled receptor binding
|
0.0276750080993787
|
292
|
36
|
4
|
0.111111111111111
|
0.0136986301369863
|
|
GO:MF
|
GO:0005201
|
extracellular matrix structural constituent
|
0.0276750080993787
|
171
|
55
|
4
|
0.0727272727272727
|
0.0233918128654971
|
|
GO:MF
|
GO:0030020
|
extracellular matrix structural constituent conferring tensile strength
|
0.0276750080993787
|
41
|
55
|
3
|
0.0545454545454545
|
0.0731707317073171
|
|
GO:MF
|
GO:0030545
|
receptor regulator activity
|
0.0276750080993787
|
545
|
47
|
6
|
0.127659574468085
|
0.0110091743119266
|
|
GO:MF
|
GO:0030546
|
signaling receptor activator activity
|
0.0276750080993787
|
501
|
47
|
6
|
0.127659574468085
|
0.0119760479041916
|
|
GO:MF
|
GO:1901681
|
sulfur compound binding
|
0.0446120009756115
|
264
|
51
|
4
|
0.0784313725490196
|
0.0151515151515152
|